Market structure is a Technical concept in trading that helps traders understand the dynamics of price movements and make informed decisions. Traders can identify trends, anticipate potential reversals, and develop efficient trading strategies by analyzing the structure of the market.
This article provides a comprehensive breakdown of market structure, its types, key components, tools for analysis, common mistakes, and its importance in trading.
Understanding Market Structure in Trading
As you know Market structures refers to the framework that how price moves in a financial market. Support and resistance levels, directions of trends, and price-pattern recognition are part of the market-structure assessment. Understanding market structure allows traders to form ideas on predicting prices, and choosing entry methods, and exit strategies.
Understanding the structure means understanding how market participants buyers and sellers behave toward each other in establishing price trends. It is not just price tracks rather it is a narrative interpretation of the market movement.
For example, with buyers coming in and dominating the prices, they keep on climbing, thereby making higher highs and higher lows. By contrast, sellers being in control brings prices down with lower lows and lower highs. An equilibrium or ranging market is when neither buyer nor seller is in control and prices are making waves in the established range.
Market structure is the foundation upon which traders and strategies are built to achieve a fit with market conditions. Having an understanding of market structure is important for navigating the complexities of the market and making informed decisions.
Types of Market Structures in Trading
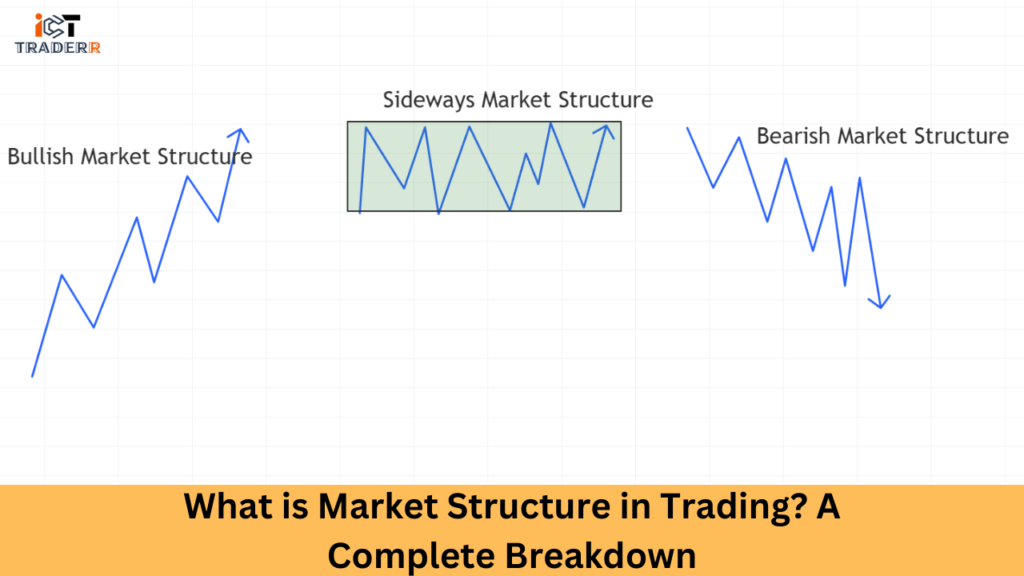
Market structures are generally classified into three big types: bullish, bearish, and sideways. Each type bears different characteristics that traders must identify so that they can act upon them to make wise investing decisions.
1. Bullish Market Structure: Anatomy of Upward Momentum
A bullish market structure represents an environment of sustained positive sentiment and upward price movement. Its characteristics include:

Detailed Characteristics:
- Consecutive higher swing highs
- Progressive higher swing lows
- Increasing trading volume during price advances
- Strong momentum indicators
- Positive market sentiment
Advanced Identification Techniques:
- Trend line analysis
- Moving average confirmations
- Volume profile studies
- Momentum latooscilr evaluations
Imagine a stock consistently breaking previous resistance levels, with each pullback finding support at higher price points. This represents a classic bullish market structure signaling potential continued upward momentum.
2. Bearish Market Structure: Navigating Downward Trends
Contrary to bullish structures, bearish market structures indicate sustained negative market sentiment and downward price movements.
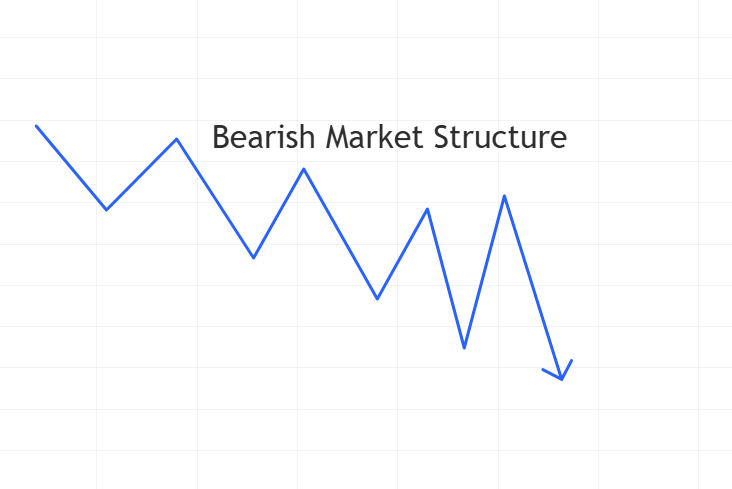
Key Characteristics:
- Consecutive lower swing lows
- Progressive lower swing highs
- Decreasing trading volume
- Negative momentum signals
- Pessimistic market psychology
Advanced Detection Methods:
- Descending trend line analysis
- Relative strength comparisons
- Volume decline confirmation
- Bearish candlestick pattern recognition
Practical Insight:
A bearish market structure might manifest as a stock consistently breaking support levels, with each price recovery failing to reach previous highs.
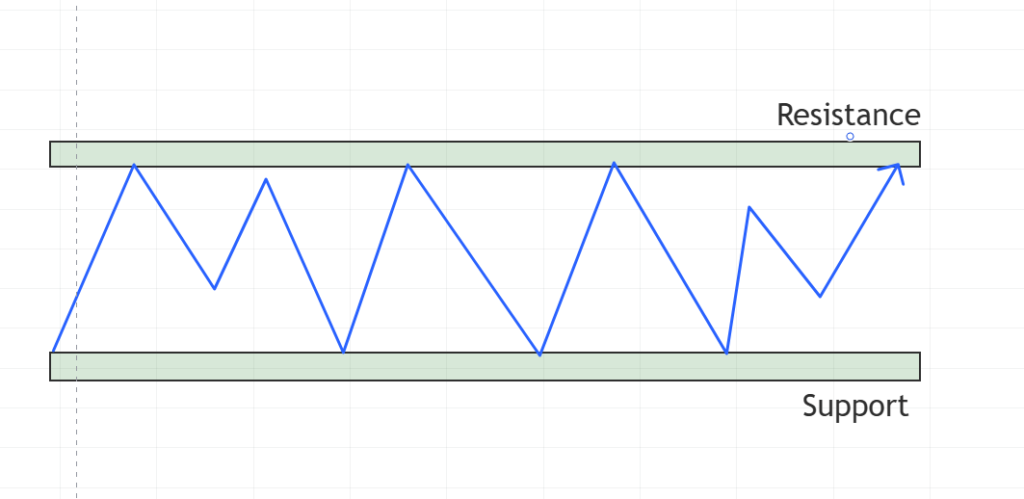
3. Sideways Market Structure: Understanding Range-Bound Markets
Sideways or neutral market structures represent periods of price consolidation, characterized by minimal directional movement.
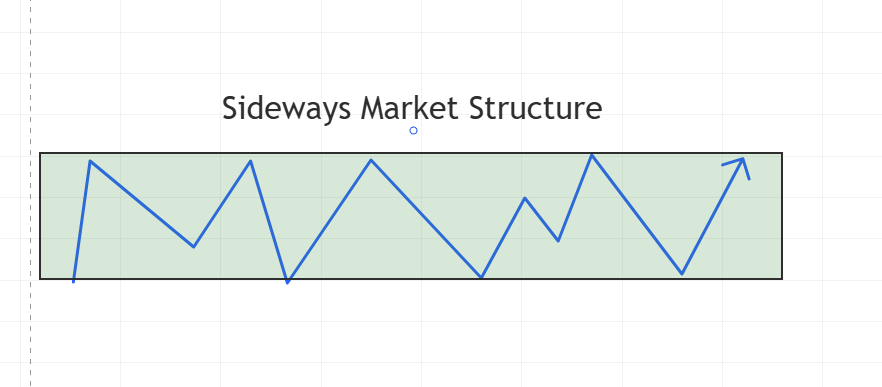
Defining Features:
- Horizontal price range
- Reduced market volatility
- Balanced buying and selling pressures
- Potential accumulation or distribution phase
Strategic Approaches:
- Range trading techniques
- Mean reversion strategies
- Breakout confirmation methods
- Volatility contraction pattern identification
Key components of Market Structure
Market structure is built on several key components that help traders analyze price action effectively. These components are essential for understanding prices and identifying potential trading opportunities.
Trends
Trends show which way the market is going. They can go up (bullish), down (bearish), or sideways (neutral). Knowing the trend helps you trade in the same direction as the market’s movement.
Support and Resistance
Support levels are price points where buying pressure is strong enough to prevent further declines, while resistance levels are where selling pressure halts upward movements. Prices frequently react to these levels because they act as barriers.
Higher Highs and Higher Lows
Higher highs and higher lows are the building blocks of a bullish trend. They indicate increasing buying momentum and are used to confirm the strength of an uptrend.
Lower Highs and Lower Lows
A bearish trend has lower highs and lower lows as its foundation. They signal increasing selling pressure and are used to confirm the strength of a downtrend.
Breakouts and Breakdowns
A breakout happens when prices go upward through resistance signifying that a slight retracement toward a trend is anticipated. On the other hand support dissolution is also another term a breakdown. These are periods at which the trader may look to take or close up a buy or sell position.
Analyzing Market Structure: Tools and Techniques
To effectively study the market structure, traders will use several tools and techniques to identify important levels of trend as well as potential trading opportunities. Below are some major tools and techniques used for market structure analysis:
Analysis of Price Action
Price action analysis is an analysis of raw price movements to see if there is a discernible pattern and trend. It is the behavior of price without reliance on indicators, again a pure form of technical analysis.
Trendline
A smart line on a chart that shows the trend based on previous high and low points. A line that back predicts the range of trade for a planned period.
Moving Averages
Moving averages, such as the 50-day or 200-day moving average, are used to identify trends and smooth out price fluctuations. They provide a clear representation of the market’s direction and momentum.
Levels of Support and Resistance
Support and resistance levels are key price levels where the market may reverse. These levels are identified by analyzing historical price action and are crucial for determining entry and exit points.
Volume Analysis
The purpose of volume analysis is to confirm the strength of a trend or breakout by studying trading volume. Low volume during a breakout or trend may indicate a weak or false move, whereas high volume indicates strong participation.
Common Mistakes to Avoid When Analyzing Market Structure
While analyzing market structure, traders often make mistakes that can lead to poor decisions. Some common errors include:
1. Overlooking Higher Timeframes
One of the major mistakes traders typically commit is to focus on a lower timeframe while ignoring the bigger picture. It could be that a particular setup looks perfect on the 15-minute chart but is trading against a massive trend on the daily chart.
How to Avoid:
- Always start the analysis from higher timeframes and work down
- Ensure trade direction aligns with the dominant trend
- Use at least three timeframes for comprehensive analysis
2. Forcing Trades in Unclear Structures
Many traders try to find trading opportunities even when the market structure is unclear or transitioning. This often leads to unnecessary losses.
How to Avoid:
- Wait for clear market structure confirmation
- Accept that sometimes the best trade is no trade
- Develop patience and discipline in trade selection
3. Ignoring Volume Analysis
Market structure analysis without volume consideration is incomplete. Volume confirms the strength of moves and can validate or invalidate apparent structures.
How to Avoid:
- Always check the volume on significant price moves
- Look for volume expansion on breakouts
- Be cautious of price movements without corresponding volume
4. Misidentifying Key Levels
Many traders incorrectly identify support and resistance levels, leading to poor trade entries and exits.
How to Avoid:
- Focus on areas of significant price rejection
- Look for multiple touches of a level
- Consider using multiple tools to confirm levels (trendlines, moving averages, etc.)
5. Over-Reliance Indicators
Indicators can be useful, but completely relying on them can lead you to lose out on opportunities or give you false signals.
How to Avoid:
- Use indicators as confirmation tools, not primary decision-makers
- Focus on price action first
- Understand that indicators lag behind the price
6. Not Adapting to Market Conditions
Markets constantly evolve, and what worked in one market structure might not work in another.
How to Avoid:
- Regularly assess market conditions
- Adjust trading strategies based on volatility
- Be flexible with entry and exit criteria
Pros and Cons Of Market Structure in Trading
Pros:
- Provides a clear framework for understanding price movements.
- Helps identify high-probability trading opportunities.
- Applicable to all financial markets and timeframes.
Cons:
- Requires practice and experience to master.
- Subjective interpretations can make the results differ from each other.
Why Market Structure is the Backbone of Every Trading Strategy
Market structure is the core framework behind any trading strategy since it affords traders an understanding of price behavior. By analyzing market structure, traders can:
1. Identifying Trends and Reversals
The market structure provides traders with a reliable framework for recognizing both trending markets and potential reversal points. This is crucial because:
Trend Recognition
- Helps traders identify the primary market direction through higher highs and higher lows (uptrend) or lower highs and lower lows (downtrend)
- Enables recognition of trend strength by analyzing the spacing and relationship between swing points
- Allows traders to spot trend continuation patterns like flags and pennants
- Helps in identifying the trend’s maturity through wave analysis
Reversal Detection
- Enables early identification of potential trend exhaustion through pattern breaks.
- Helps spot double tops/bottoms and other reversal patterns
- Allows recognition of momentum divergence signaling possible reversals
- Aids in identifying key support/resistance levels where reversals commonly occur
2. Determining Optimal Entry and Exit Points
Understanding market structure is essential for timing trades effectively:
Entry Points
- Helps identify high-probability entry zones after pullbacks in trending markets
- Enables recognition of breakout points from consolidation patterns
- Allows traders to spot optimal entry points at support/resistance levels
- Helps in identifying low-risk entry opportunities through pattern formations
Exit Points
- Provides clear profit targets based on previous market swings
- Helps identify potential resistance levels where profits should be taken
- Enables trailing stop adjustments based on market structure shifts
- Allows for strategic scaling out of positions at key structural points
3. Managing Risk Effectively
The market structure provides a framework for implementing robust risk management:
Stop Loss Placement
- Offers logical stop loss points based on recent swing highs/lows
- Helps identify invalidation points where the trade thesis would be wrong
- Enables proper position sizing based on clear risk points
- Provides reference points for trailing stops in trending markets
Risk-Reward Assessment
- Allows calculation of potential reward based on structural targets
- Helps maintain favorable risk-reward ratios by identifying clear profit objectives
- Enables traders to assess trade quality before entry
Understanding these three aspects of market structure enables traders to:
- Make more informed trading decisions
- Maintain consistency in their approach
- Develop confidence in their trading strategy
- Improve overall trading performance through structured analysis
This systematic approach to trading using market structure significantly increases the probability of successful trades while maintaining proper risk management principles.
What Is the Best Time Frame for Analyzing Market Structure?
The best time frame for analyzing market structure will vary according to your trading style:
- Scalpers: Use lower timeframes (1-minute to 15-minute charts).
- Day Traders: Use medium timeframes (30-minute to 1-hour charts).
- Swing Traders: Use higher timeframes (4-hour to daily charts).
- Position Traders: Use the highest timeframes (weekly to monthly charts).
Whatever your style, remember to analyze different time frames for a wider market perspective.
Conclusion
Understanding market structure helps traders understand price movements and make better decisions. Knowing various types of market structures, key components of market structures, and analysis techniques will enable traders to develop winning strategies and enhance their chances of success. In addition, you should learn to avoid the common mistakes one can make, adapt to ever-changing market conditions, and always keep risk management as your top priority.
FAQs
What is the market structure in trading?
Market structure is used to describe the character of price movement within financial markets which can be realized through trends, supports and resistances, and consolidatory periods.
What are the different kinds of market structures?
The three primary kinds of elements -that is, bullish, bearish, and sideways- are in a market structure.
How can the structure of the market be analyzed?
An investor can analyze the structure of markets using oscillation graphics, trend lines, moving averages, and the underlying support/resistance levels of a market.
Why is market structure important for trading?
Trading is significant because it helps to read the price action and determine trends that are indicative of an effective trading strategy.
What is the best period for analyzing market structure?
These are the perfect ingredients since the best timeframe depends on what suits your trading style, and multiple timeframe analysis ensures better insight.