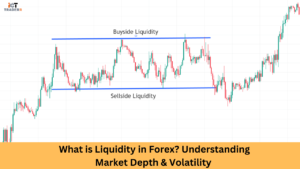
Support and resistance are considered insider weapons of professional traders. These levels help traders identify potential entry and exit points, manage risk, and, more generally, make informed trading decisions. The Support and Resistance levels are where traders work collectively with buying or selling. For example, whenever the price goes to a level of support, the buyers come with the hope that the price will also bounce back. On the other hand near a level of Resistance, sellers tend to rule, expecting the price to drop.
In this article, We will discuss all the important Support and Resistance principles and related topics from beginning to advanced trading strategies. By the end of this article, you should have developed great eligibility for further implementing the Support and Resistance levels in your trading strategy for better trading performance.
What is Support & Resistance?
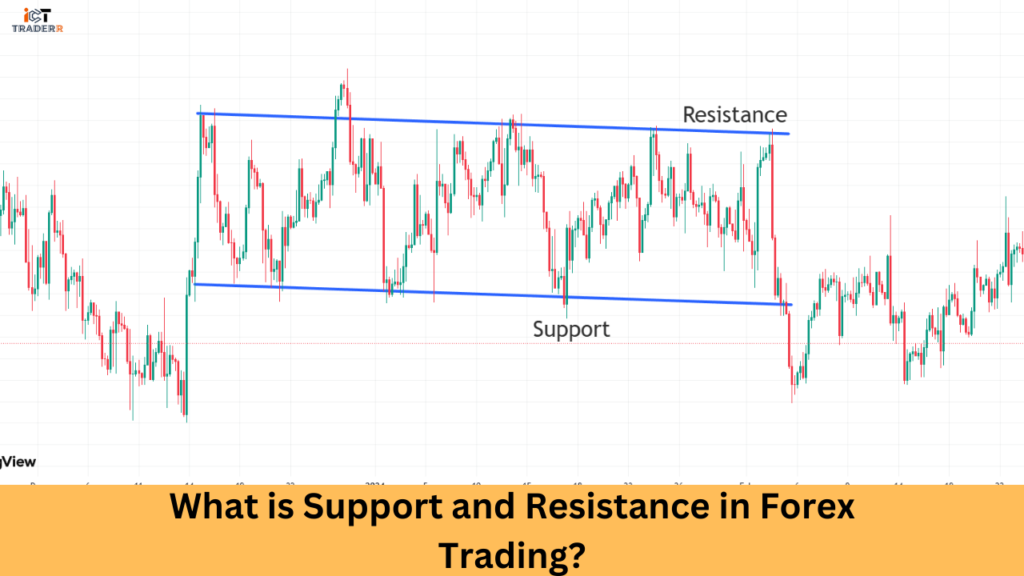
Support and resistance, in technical analysis, are basic concepts applied to the identification of critical price levels where the market will likely reverse or stall.
Support is that price level at which buying interest is too strong to allow the price to drop any further. In other words, it is street talk for a “floor” that supports the price. When the price comes to a Support level, traders generally see it as an opportunity to buy, which increases demand and hence pushes the price up.
Resistance is the price level at which selling interest is too strong to permit the price to move any further up. It is street talk for a “ceiling” that taps off the price. When the price approaches a Resistance level, traders usually opt to sell, expecting the price to drop. Increasing supply due to the selling further pushes the price down.
These levels can be dynamic and change as time goes by under various conditions in the market. Traders use them to identify certain entry and exit points that are crucial for their successful trading.
How to draw strong support and resistance levels?
The Drawing and Identifying of Support and Resistance levels is a mixture of art and science. In this regard, we will discuss how would you know about it.
Step-by-Step Procedures for Drawing-of-Levels
Observe the historical price charts to locate the areas in which the price has reversed many times.
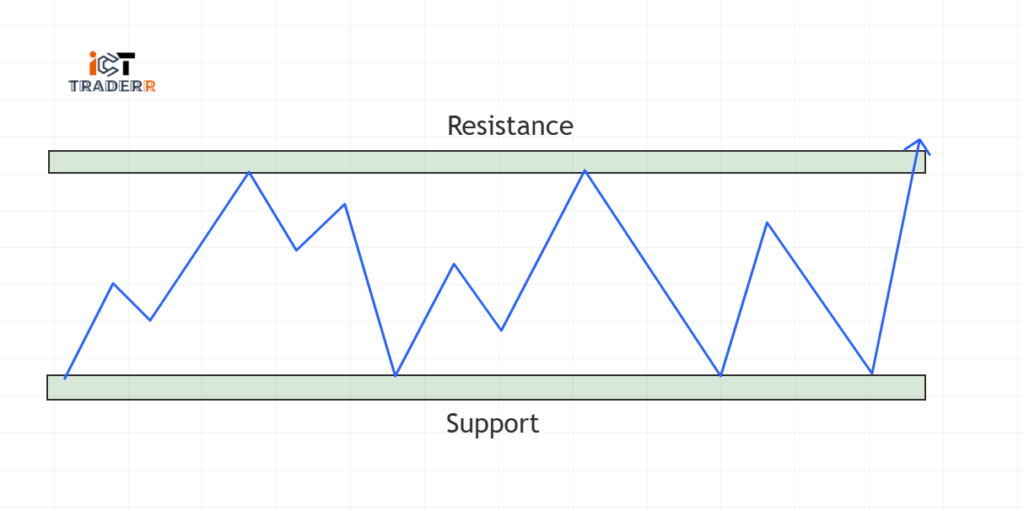
To draw Support, connect the swing lows (the lowest points before the price bounces up).
To draw Resistance, connect the swing highs (the highest points before the price drops).
Mark these levels with horizontal lines on your charting platform.
Identifying Strong Levels
A strong Support or Resistance level is thus one that has been tested many times without breaking.
The levels that coincide with other technical tools, for example, Fibonacci retracements or moving averages will be far more dependable.
Watch levels that are coinciding with round numbers (e.g., 1.2000, 1.3000), as these are often psychological barriers.
Tools and Techniques
Use trendlines to set dynamic Support and Resistance levels in trending markets.
In conjunction with horizontal levels, use some confirmation indicators, such as moving averages or Bollinger Bands.
Types of Support and Resistance Levels
Support and Resistance levels exist in various types each with its intrinsic characteristics:
Support and resistance levels are not one size. Understanding the different types can significantly enhance your trading strategy. Let’s dive deep into the various categories of support and resistance levels that traders use to navigate financial markets.
1. Horizontal Support and Resistance Levels
What Are Horizontal Levels?
Horizontal support and resistance levels are static price zones that remain consistent across different time frames. These are the most straightforward and commonly used levels in technical analysis.
Characteristics
Perfectly horizontal on the price chart
Represent clear price points where the market has repeatedly reversed
Easy to identify visually
Most reliable when tested multiple times
How to Identify
Look for price points where the market has bounced up (support) or rejected down (resistance)
Connect multiple similar price points with a horizontal line
More touches indicate a stronger level
2. Dynamic Support and Resistance Levels
Understanding Dynamic Levels
Unlike horizontal levels, dynamic support and resistance levels move with the price, adapting to market trends and changing conditions. You can use trendlines as dynamic support levels.
Key Types of Dynamic Levels:
a)Trend Lines
Diagonal lines connecting series of lower highs or higher lows
The slope indicates market momentum

b) Moving Averages
Constantly shifting average price over a specific period
Common periods: 50-day, 100-day, 200-day moving averages
This acts as dynamic support and resistance in the trending market
Different moving averages can provide multiple layers of analysis
c) Fibonacci Retracement Levels
Mathematical levels based on key Fibonacci ratios (23.6%, 38.2%, 50%, 61.8%)
Identify areas of potential reversal during market corrections.
Highly respected by institutional traders
3. Swing High and Swing Low Support and Resistance
Swing highs and lows represent critical points where market direction potentially changes.
Swing High: Highest point before a price decrease
Swing Low: Lowest point before a price increase
If you’re interested in diving deeper into how swing highs and lows shape a bullish market trend, read this detailed article: How to Analyze Higher High and Higher Low in a Bullish Market.
Breakouts and Fakeouts: How to Spot Them?
Fakeouts and breakouts are one of the numerous things in Forex trading, and the proper identification of these situations may save you from costly mistakes.
What are Breakout and Fakeout?
Breakout:
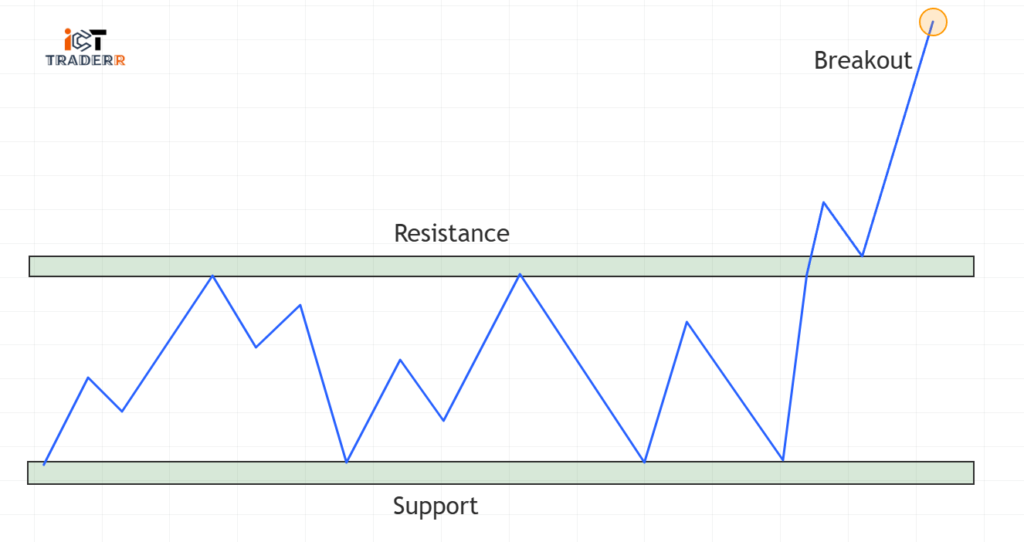
A breakout occurs when the price crosses any major support or resistance level with strong momentum in the direction of the potential trend continuation.
For example, if the price breaks and is close to resistance with increased volume it means that buyers are in control and the price will rise further. A breakout space is considered a good opportunity to enter a new trade.
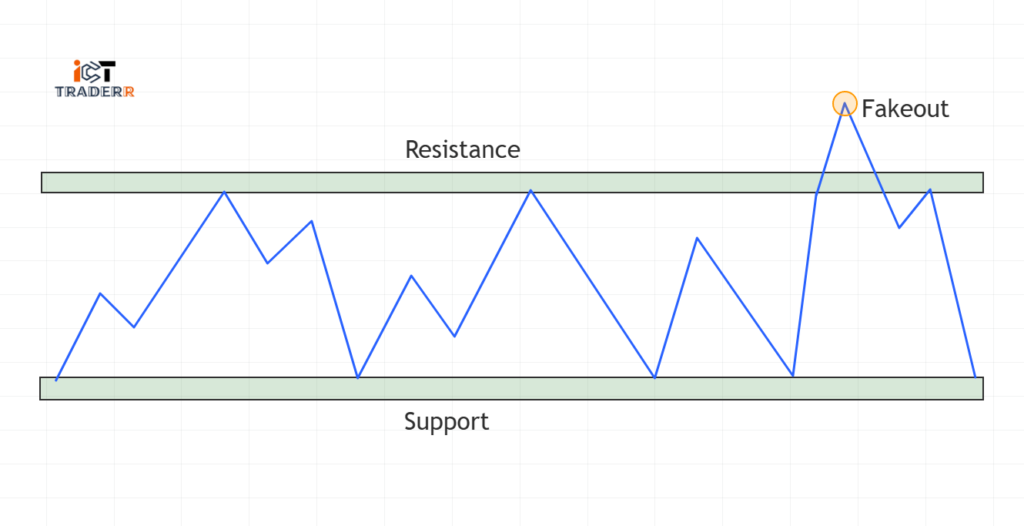
Fakeout:
Fakeouts are false breakouts. They occur when the price temporarily breaks through a support or resistance level and quickly reverses, trapping traders who entered too soon. Fake-outs create traps that mislead traders who then incur losses when they don’t see them coming.
Identifying the Real Breakout and Fakeout
As you know the identification of real breakout and fakeout is done through different ways.
1. Volume
An authentic breakout frequently comes with an increase in trading volume. High volume will confirm that the breakout has a great meltdown and is likely to continue further.
2. Candlestick Patterns
After the breakout, a candlestick pattern indicating a strong bullish or bearish candle should be visible. For example, any large bullish candle breaking above the resistance is in good favor of a valid breakout.
3.Wait for a Retest
Do not get involved in trading right after a breakout. Instead, wait to see if the price retests the broken level. If the rice is found holding above-broken Resistance (now Support) or below-broken Support (now resistance), the validity of the breakout would be confirmed.
Tips to Avoid Fakeouts
Here are some tips to avoid fakeouts:
Use Multiple Time frames
Always confirm breakouts in higher time frames. For instance, if the breakout occurred on an hourly chart, check on 4-hour or daily charts to see if the level is relevant. Breakouts confirmed in higher time frames will be more reliable.
Combine with Indicators
Using indicators like RSI (Relative Strength Index) and MACD (Moving Average Convergence Divergence) is useful for filtering false signals. The RSI reading indicating overbought status during the time of a breakout is an indication of a probable fakeout.
Setting Stop Loss Orders
In this context, use stop-loss orders to shield yourself against fakeouts. For a long position, one would set a stop-loss level just below the breakout point for a short position above it.
Best Trading Strategies Using Support and Resistance
Using support and resistance effectively requires well-defined trading strategies. Here are three powerful methods:
1. Breakout & Fakeout Trading (Spotting Real vs. False Breakouts)
- Identify key support and resistance levels.
- Wait for a strong breakout with volume confirmation.
- Enter trades on a pullback to the broken level.
- Use stop-loss below/above the level to minimize risk.
2. Range Trading Strategy
- Identify horizontal support and resistance levels.
- Buy at support, sell at resistance.
- Use tight stop-loss and target recent highs/lows.
3. Trendline Bounce Strategy
- Draw a trendline connecting higher lows (uptrend) or lower highs (downtrend).
- Enter trades when the price bounces off the trendline.
- Use additional indicators for confirmation.
Indicators to Use for Support and Resistance Trading
The use of technical indicators can help you trade support and resistance more effectively. Among the most well-liked are:
Moving Midpoints (50, 100, 200 EMA): Distinguishes dynamic help/opposition.
Fibonacci Retracement: Predicts value pullbacks and inversions.
Bollinger Groups: Measures market instability and cost deviation.
Relative Strength File (RSI): Distinguishes overbought/oversold conditions.
Volume Pointer: Confirms breakouts and fakeouts.
Common Mistakes Traders Make with Support and Resistance
Even experienced traders can make mistakes when trading support and resistance. Here are some common pitfalls to avoid:
Over-reliance on Single Levels
Relying solely on one Support or Resistance level without confirmation can lead to poor trading decision
Ignoring Higher Timeframes
Higher timeframes (daily, weekly) provide stronger and more reliable levels.
Failing to Adjust Levels
Support and resistance are not fixed once, they always need to be watched over time according to market activity.
Conclusion
To make informed decisions in forex trading, the fundamental concepts of support and resistance must be understood. It is not only about drawing lines on a chart that constitutes the application of support and resistance levels within the forex market. It entails understanding the market psyche and making the best trading decisions. Throughout this guide, we have seen how these remarkable technical tools can beautify one’s trading practice.
Don’t get discouraged when you face difficulties at first. Each time you analyze support and resistance levels, you gain value-added experience. Start with simple horizontal levels, then move on to dynamic ones, and finally to advanced ones, such as breakout trading. Focus on simplifying your analysis a convoluted chart with too many lines provides little clarity.
These concepts provide an understanding of market structure, with avenues to explore potential trade opportunities and manage risk. If you master these concepts, you have laid a very strong basis for the forex trading journey ahead.
FAQs
Can support and resistance be used in all market conditions?
While most effective in trending and range-bound markets, the principles can be applied across various market scenarios with proper adaptation.
How many times should a level be tested to be considered strong? Typically, 2-3 tests make a support or resistance level more reliable, but context and additional confirmations are crucial.
Are support and resistance levels the same across all time frames? Levels can vary across time frames. Professional traders often analyze multiple time frames for a comprehensive view.
Can beginners effectively use support and resistance?
Absolutely! With practice, study, and gradual implementation, beginners can integrate these techniques into their trading strategy.