In trading, knowledge about the liquidity of markets is necessary to make informed decisions. Liquidity is the backbone of financial markets, and once you can master the dynamics, your strategies will be taken to the next level. This is a fantastic guide on Internal Range Liquidity (IRL) and External Range Liquidity (ERL) as explained by ICT (Inner Circle Trader). We will also tell you why price moves, how liquidity mapping works, and how to use IRL and ERL to spot possible high-probability trading opportunities.
The Core Concept: Why Does Price Move?
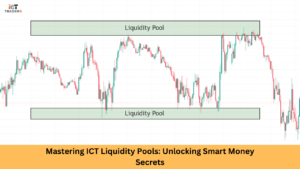
Price movement in financial markets is a struggle between buyers and sellers. This suggests that the model is more complicated than this simple dynamic liquidity. Liquidity means buy and sell orders in the market. Even if a huge number of buy orders at a certain price level pile up, that price level may become a pool of liquidity.
Smart money (institutional traders) usually manipulates the prices of these liquidity pools because the execution of a large number of orders requires enough liquidity in the market. Knowing that and its performance helps in anticipating what the price would do next, and where it does, will, in most cases, align your trade with the market’s structural narrative.
“Build your basics stronger with our Liquidity Sweep and Liquidity Void guide.”
ICT Dealing Range: The Foundation of Liquidity Mapping
The Dealing Range appears to be the area of consolidation before price-moving activity. Such analysis of dealing ranges allows traders to identify places where smart money needs to hunt for liquidity.
This liquidity lies between Swing Highs and Lows, attracting stop-hunts before market direction shifts.
The dealing range is generally classified into two types regarding liquidity:
- Internal Range Liquidity (IRL)
- External Range Liquidity (ERL)
Let’s break down each of these in detail.
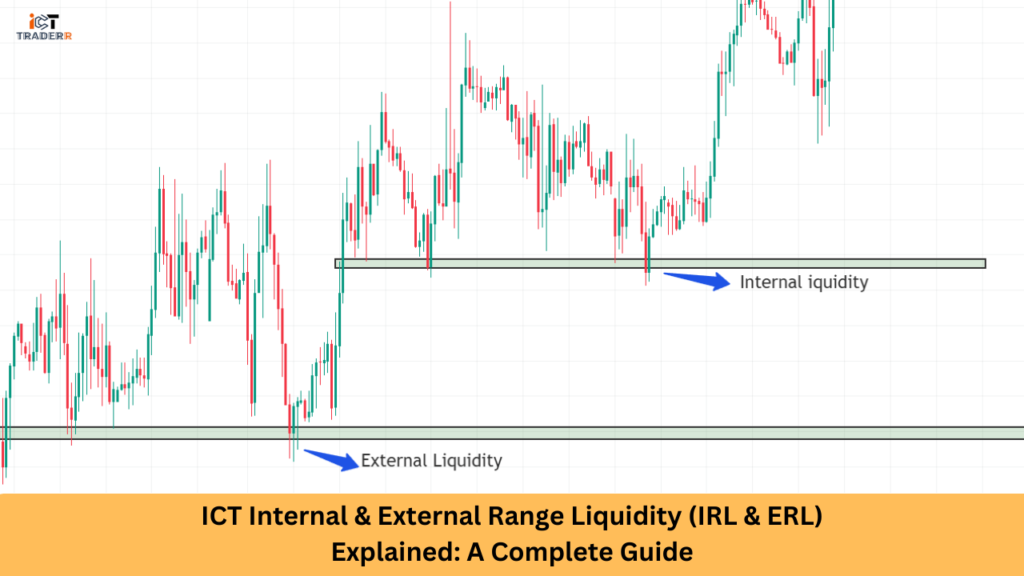
Internal vs. External Range Liquidity: A Detailed Breakdown
Internal Range Liquidity (IRL)
Internal Range Liquidity refers to those liquidity pools that are laid out within the current working price range or consolidation zone. They are invariably below swing highs and swing lows within that range.
Common features of IRL:
- It is always found within the recent price action.
- It is often defined by retail traders’ stop-loss orders.
- It behaves like a magnet in front of any price move: breakouts or reversals.
How To Identify IRL:
Look for areas where the price reverses and/or consolidates multiple times.
Point out IRL zones through the use of support and resistance levels, trend lines, and Fibonacci retracements.
External Range Liquidity:
External range liquidity consists of those liquidity pools, which lie outside the current price range. It usually is near previous swing highs and swing lows or at major support and resistance levels.
Common features of ERL
- This exists outside of the recent price action.
- It mostly will be marked by stop-loss orders from traders who have stuck in the wrong trades.
- It becomes a target for price movement post-breakout/trend continuation.
How To Identify ERL:
Look at previous turning points with indications of rejection or possible consolidative areas.
Fibonacci extensions, previous highs and lows, and even some psychological levels can be applied to identify ERL zones.
| Feature | IRL | ERL |
| Location | Inside Dealing Range | Outside Dealing Range |
| Liquidity Type | Retail mistakes, stop clusters | Stop hunts, breakout traps |
| Smart Money Behavior | Reaccumulate/distribute | Liquidity grab and reverse |
| Trade Utility | Confirm entries or scalps | Spotting breakout traps/reversals |
How Smart Money Hunts Liquidity and Manipulates Price
Smart money usually goes around looking for liquidity to execute its big orders without moving the market too much. Here’s how the process works:
Stop Hunts:
Smart money pushes the price to levels where the retail traders have placed their stop-loss orders. By triggering the stops it offers the liquidity to fill its orders.
Liquidity Grabs:
Price is pushed to these key IRL or ERL zones to absorb liquidity before being reversed or continuing in the intended direction.
Order Flow Manipulation:
By creating false breakouts or fakeout, smart money targets retail traders’ entries just to reverse the market on them and trap them.
Understanding these tactics allows traders to anticipate price movements and avoid falling into traps set by smart money.
Often, Inducement Patterns are formed around internal liquidity to bait retail orders.
Best Timeframes to Spot IRL & ERL for High-Probability Trades
To identify IRL and ERL efficiently, multiple timeframes should be analyzed. Here’s a layout we recommend:
Higher timeframes (HTF):
Daily (D1) sound or 4-hour (H4) chart for the big support and resistance area, major swing highs, and major swing lows.
These levels mostly act as ERL zones.
Lower timeframes (LTF):
1-hour (H1) or 15 minutes (M15) to give IRL zones within the ongoing price action
These levels are excellent for entries and exits.
By covering HTF and LTF analysis, you can flow with the market on a bigger picture while capitalizing on short-term opportunities.
📊 Timeframe Strategy:
| Timeframe | Use Case |
| Daily | Mark dealing range & external liquidity |
| 4H | Refine structure & direction |
| 1H | Spot IRL for setups |
| 15m | Entry confirmation via price action |
| 1m–5m | Precision entries during kill zones |
🎯 Sessions to Watch:
- London Open – Often clears internal liquidity
- New York Open – Frequently sweeps ERL and creates reversals
Use the Daily Bias to guide which liquidity zone price can be targeted.
Identifying Daily Bias Using IRL & ERL
The appropriate method of utilizing the most powerful IRL and ERL is to establish a daily bias. Here is given below:
Study the HTF Levels:
Key ERL zones have to be identified on the daily or 4-hour chart.
Then determine whether price is likely to penetrate these zones based on the current market structure.
Examine LTF Price Action:
Search IRL zones in lower timeframes confirming the price movement direction.
Use candlestick patterns, volume analysis, and momentum indicators to validate your movement.
Align Trades with Bias:
If the daily bias is bullish, it must seek to buy near IRL zones.
If the daily bias is bearish, it would seek to sell near the IRL zone.
Conclusion
If you understand Internal and External Range Liquidity (IRL & ERL) then you are the winning trader of the ICT (Inner Circle Trader) model. These concepts are essentially what underlies the smart money theory but overall applied correctly, they are capable of assisting traders by offering much clearer direction, entry precision, and risk control.
It does not matter whether the contest is in scalping, day trading, or swing trading understanding IRL and ERL can help you sidestep the retail traps and follow the footprints of institutional traders.
Now you add liquidity into the charts and mix that with robust daily bias and timeframe alignment, and you will see how much better your setups are with more confidence and accuracy.
FAQs
What is the difference between IRL and ERL?
Internal range liquidity is found within the current dealing range, whereas external range liquidity is found outside of it. ERL usually engenders stop hunts and larger price reversals.
How do you find dealing ranges?
Take the high and low of the previous day to derive the dealing range for intraday trading, or use that of the week for swinging trades.
Can IRL & ERL be used in all markets?
Yes. Though liquidity flows from forex, cryptocurrency, indices, and commodity markets, the above applies as long as there is enough volume and smart money activity in the market.
Is it possible to scalp using IRL?
Definitely! Short-term liquidity zones produced by IRL are best for scalps and quick entries, particularly when viewed at certain times of day such as in the London or New York sessions.
Do I have to use indicators for trading IRL and ERL?
No indicators are needed. These concepts rely on price action, structure, and liquidity mapping, thus being very powerful tools for naked chart traders.