As you know, a bullish pennant is one of the most remarkable continuation patterns within technical analysis. It indicates a temporary pause with an uptrend before the price movement resumes toward the north. Most traders use a bullish pennant to identify the next possible buy entry point in trending markets.
In this article, we will explain what a Bullish Pennant is, its Essential Characteristics, how to identify a Bullish Pennant on a Chart, and how to trade with the Bullish Pennant Pattern.
Let’s get started!
What is a Bullish Pennant?
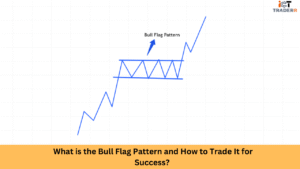
A bullish pennant is a continuation chart pattern that signals a potential continuation in the direction of the prevailing uptrend. It is an extensively construed pattern in technical analysis that helps you spot opportunities for profitable trades within bullish markets. The pennant formation usually complied with after an aggressive price rally which is then followed by a brief period of consolidation that takes the form of a small symmetrical triangle before proceeding with another breakout.
Bullish Pennants appear during consolidation after an impulsive Displacement Move.
The bullish pennant remains an important tool for you to reap profits in a momentum-driven market. It has a high occurrence in stocks, forex, and cryptocurrency trading, therefore serving as a very indicator across numerous financial markets.
Key Characteristics of a Bullish Pennant
For a proper identification and trading of bullish pennants, you need to understand the main features. These elements are the specific characteristics that describe this pattern:
Supply and demand dynamics initiated the bullish pennant with a steep price rise (flagpole). Imposing upward pressure illustrates to traders the strength of buying and provides the base for discussion of the pattern.
The consolidation phase, which takes the form of a pennant, marks the end of a very strong uptrend, and it is followed by a period of consolidation where the price temporarily settles to a small or symmetrical triangle or pennant form. The price is in a sideways direction with lower volatility in this phase.
The break area follows the direction of the uptrend. After the consolidation, the breakout occurs above the pennant’s upper resistance point, thereby announcing the continuation of the bullish trend.
Volumes generally reduce during consolidation and then spike when the breakout occurs. Thus, a high volume spike confirms the breakout validity.
Price targets usually result from the length of the initial flagpole, which is extended further upward from the breakout.
Look for Liquidity Pools and Order Blocks nearby for high-probability trades.
Identify a Bullish Pennant on a Chart
Observing price movements and volume changes closely against bullish pennant characteristics will help you identify such formations on trading charts. Thus:
Look for a Strong Upward Move: Here is the very steep and almost vertical price rise forming the flagpole. It signals that the market is currently retailing huge amounts of shares.
Observe the Consolidation Phase: Set your price into either of the two or into both ranges provided by the converging trendlines.
Look for Falling Volume: During the pennant formation, trading volume should gradually decline, reflecting reduced activity as you await the next move.
Wait for a breakout above: The regained ground will be confirmation of price action by placing it above the top resistance line of the pennant with an increase in volume.
Using a Technical Indicator for Confirmation: Complement your study through an indicator such as Move Averages, Relative Strength Index (RSI), or MACD to confirm bullish momentum.
How to Trade the Bullish Pennant Pattern?
Like other forms of the pennant pattern, the bullish pennant pattern has its respective good entry with stop-loss and take-profit levels. Here is the procedure, step by step:
1. Entry Point:
A buy position is taken when an upward movement in the price breaks through the pennant resistance level, supported by high volume.
A confirmation candle can be useful in averting false breakouts.
2. Stop-Loss Placement:
A stop-loss order should be placed slightly below the lowest point of the pennant for risk limitation. As long as the price keeps on moving in favor of a trader, he can adjust the stop-loss.
3. Take-Profit Target:
The price target is set by measuring the flagpole length and adding it to the breakout point.
Trailing stop-losses can be useful to lock in profits while also allowing for additional profits.
4. Risk Management:
Risk only a small amount of your capital in each trade.
Maximise on risk-reward ratios (1:2 or 1:3) to yield more profit.
5. Monitor for Market Conditions:
Stay updated on news, earnings reports, and macroeconomic events affecting the market.
Consider additional technical indicators for confirming analysis.
Conclusion
The bullish pennant is a very strong continuation pattern used by traders to take advantage of strong uptrends. By knowing its important elements, like the flagpole, consolidation phase, and breakout, traders can make profitable trades based on facts. With proper risk management strategies, traders can translate this into successful trades. But remember to always confirm breakouts with volume.
By understanding the bullish pennant, traders will become better at technical analysis and improve their chances of making successful trades in an uptrending market.
FAQs
How reliable is the bullish pennant pattern?
The bullish pennant is a highly reliable pattern, especially when confirmed with volume and other technical indicators. However, no pattern based on technical analysis guarantees success, which means that risk management becomes essential.
Can the bullish pennant show up in all financial markets?
Yes, it can be seen in stocks, forex, commodities, and cryptocurrencies, thus being a versatile trading pattern.
What time frame is best for trading bullish pennants?
Although bullish pennants can appear on multiple time frames, they are most useful on higher time frames like 1-hour, 4-hour, and daily charts.
What is the difference between a bullish pennant and bull flag?
While both patterns are continuation patterns, the difference is that bullish pennant forms a symmetrical triangle while bull flag has a rectangular consolidation area.
What can I do to avoid false breakouts when trading a bullish pennant?
After the breakout, wait for a confirmation candle, and make sure the trade volume increases before entering.