A very popular continuation pattern in technical analysis, the bear flag pattern signals the resumption of the downward trend. Traders use this pattern to identify short selling strategy and generate maximum profits in a bearish flag pattern.
In this blog post, we will discuss what the Bear Flag Pattern is, its major characteristics, how to recognize it in a chart, and effective trading strategies.
What is the Bear Flag Pattern?
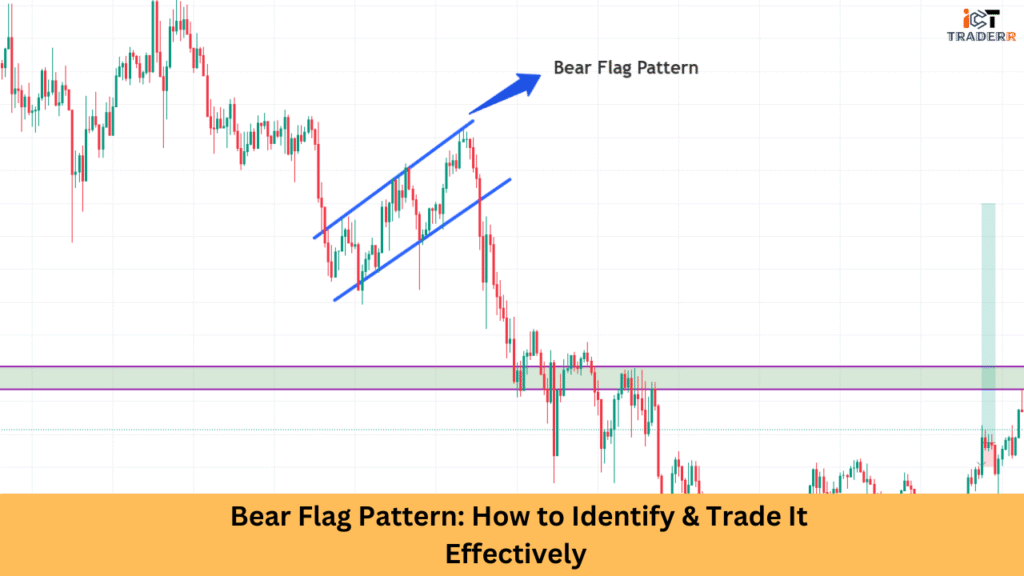
The flag pattern trading is a continuation bearish formation appearing after a strong downward price movement (the flagpole) followed by a little upward or sideways consolidation (the flag). This pattern suggests that the sellers are taking a brief rest before continuing the downtrend.
Bear Flags follow strong bearish Displacement Moves signaling continuation.
Key Characteristics of a Bear Flag Pattern
To identify a bear flag correctly, you must be able to recognize its defining features. These characteristics distinguish a bear flag from other similar-looking patterns:
1. Sharp Downward Move (Flagpole):
The pattern begins with a steep price decline. This move should be swift and accompanied by high volume, indicating strong selling pressure.
2. Consolidation Channel (Flag):
After the sharp drop, the price enters a short consolidation period. This forms a small, sloping channel or horizontal range, typically against the direction of the original trend.
3. Low Volume During Consolidation:
The flag usually shows reduced trading volume, reflecting a temporary pause in bearish sentiment.
4. Breakout to the Downside:
Once the consolidation ends, the price breaks out typically below the lower trendline of the flag. This confirms the continuation of the downtrend.
5. Measured Move Target:
The potential price target after the breakout is often estimated by measuring the length of the flagpole and projecting it downward from the breakout point.
How to Identify a Bear Flag Pattern on a Chart?
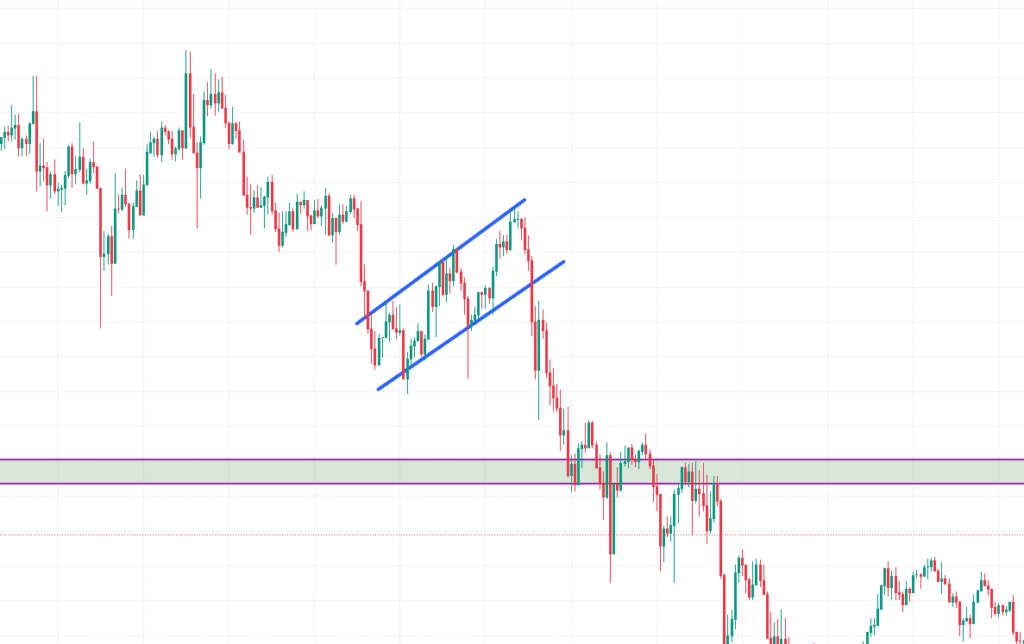
Spotting a bear flag pattern requires attention to price structure and volume dynamics. Here’s how you can identify it step by step:
✅ Step 1: Look for a Steep Downtrend
Use a candlestick chart and observe for a strong bearish move, usually formed by consecutive red candles.
✅ Step 2: Identify the Flag Structure
After the initial drop, look for a tight consolidation range or a slight upward channel. Ensure the slope is moderate and does not negate the earlier drop.
✅ Step 3: Watch the Volume
Volume typically spikes during the flagpole and declines during the flag. This is an important confirmation signal.
✅ Step 4: Confirm Breakout
When the price breaks below the lower boundary of the flag on increased volume, it indicates a valid breakout and continuation of the downtrend.
✅ Step 5: Use Indicators for Confirmation
Rely on indicators that measure momentum, such as RSI (Relative Strength Index), MACD, or moving averages, to confirm bear momentum before actually entering trades.
Entries are confirmed near Fair Value Gaps within the flag.
How to Trade the Bear Flag Pattern?
Trading the bear flag pattern can be highly effective when approached with discipline and proper risk management. Here’s a trading plan you can follow:
Entry Point
Enter a short position when the price breaks below the flag’s lower trendline with high volume. For extra safety, wait for a candle to close below the support line.
Stop Loss Placement
Set your stop loss just above the upper boundary of the flag. This helps protect your capital if the pattern fails or results in a false breakout.
Profit Target
You measure the length of the flagpole and subtract it from the breakout point, and that’s your take profit level.
For example, if the flagpole is 50 points and the breakout occurs at 100, around 50 would be your target.
Management of the Trade
A trailing stop to secure profits as price moves in your favor should apply. Also, keep an eye on price action for signals of reversal or bearish strength.
Complementing Other Tools
Your trading setup can be improved by creating a mix of the bear flag with Fibonacci Retraces, support and resistance zones, or moving average crossovers.
A bear flag formation is considered a strong pattern for traders out to profit from the market’s downtrends. Understanding the structural formation of this pattern sharp decline, tight consolidation, and breakout-will instill confidence in when to enter and exit the trade.
Conclusion
As with any other technical setup, risk management should be applied alongside the bear flag, along with confirmation signals from indicators or volume. When one masters the bear flag, he or she can pick this pattern as an edge in her trading strategy development and consistent performance on volatile markets.
FAQs
Is the Bear Flag Pattern Reliable?
Yes, it’s considered one of the most reliable continuation patterns when confirmed with volume and breakout direction. However, no pattern guarantees success, so risk management is essential.
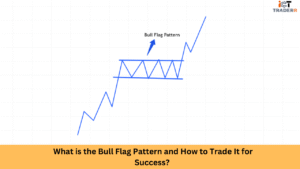
What’s the difference between a Bear Flag and Bull Flag?
A Bear Flag appears in a downtrend, while a Bull Flag forms in an uptrend.
What Are the Best Time Frames for Bear Flag Trading?
The pattern can be found at any time frame, but the higher it is, like for example, an hour, four hours, or daily chart, the more reliable signals are developed.