Do you know that a good understanding of technical chart patterns helps in the prediction of future price movements in the financial market. One such popular price pattern is the bull flag pattern. The pattern is very strong and reliable as it indicates very aggressive upward momentum. The pattern is popular among day traders and swing traders alike.
Bull Flag patterns often form after a strong Displacement Move, indicating continuation.
In this article, we will discuss in detail what the bull flag is, its identification, and most importantly, how to trade it for maximum potential profit.
What is a Bull Flag Pattern?
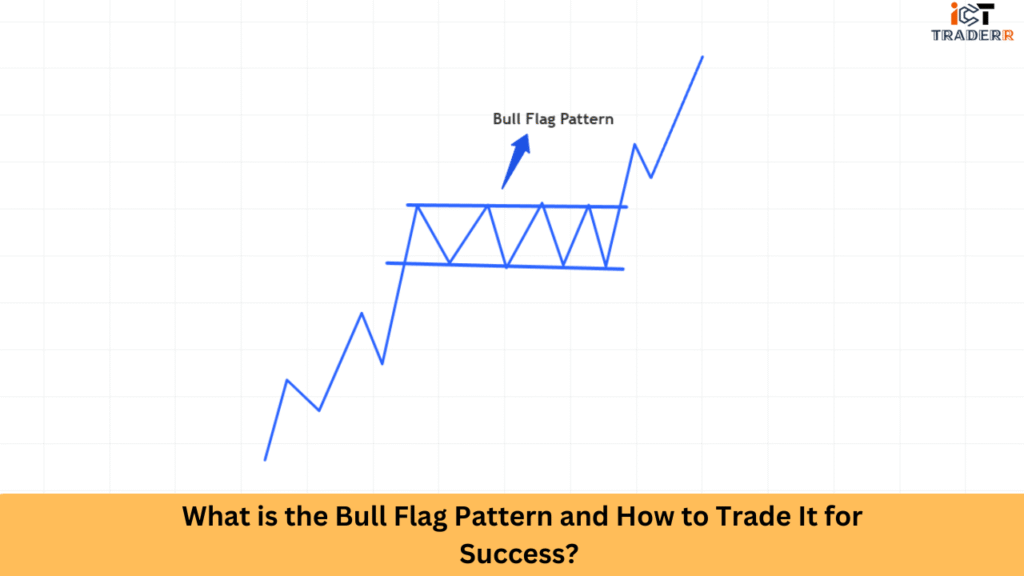
A continuation pattern, the bull flag pattern, occurs during an upward trend. It looks like a flag on a pole, in which the pole is a sharp upward price movement, while the flag appears like consolidation or slight retracement. After the consolidation, it is generally accepted that the price will break above in line with the previous trend upwards.
This pattern tells you that bulls are taking a short break before pushing prices higher again. It indicates positive sentiment in the marketplace, buyer strength, and the possibility of fresh upward movement.
Confirm entries near Order Blocks that align with the pattern.
Key Characteristics of a Bull Flag Pattern
Understanding the essential features for recognizing and trading this pattern:
Strong Uptrend (Flagpole): The formation of this pattern requires a swift price move with high volumes, and on this movement, another base is formed, insolated by the consolidation.)
Consolidation (Flag): After the fast rise, the price consolidates in a boxy or rectangular range that usually goes downwards or trends sideways.
Low Volume Through Flag Formation: In the process of flag making, trading volumes generally drop. This signifies that the momentum was on pause.
Confirmation of the Breakout: On increased volumes, a breakout above the flag’s upper trendline indicates the pattern’s validity.
Continuation of Trend: After the breakout, the price resumes upward movement almost invariably, indicating a strong buy signal.
Such characteristics make the true flag from other market moves or false breakouts.
How to Identify a Bull Flag Pattern on a Chart?
Follow these steps to spot a Bull Flag pattern effectively:
Step 1: Locate the Flagpole
The price must have seemed in a strong upward motion, almost vertical (flagpole).
The motion is rather steep, generally supported by high volume.
Step 2: Recognize the Flag Consolidation
After the flagpole, the price should enter a tight range of consolidation.
The flag can be a rectangle or a channel that descends.
This is an area that has declined in volume.
Step 3: Watch for the Breakout
A valid breakout occurs when the price moves above the upper trendline of the flag.
An increase in volume on the breakout is confirmation.
Step 4: Determine the Price Target
The price target is typically set at the highest of the flagpole added to the breakout point.
- Example: If the flagpole was 10tall,thepricemayrise
10tall,thepricemayrise10 after the breakout.
How to Trade the Bull Flag Pattern?
Identifying the bull flag gives way to an easy and (hopefully) profitable trading pattern when done with the right parameters. Here is how it is done:
Entry Point
The best time to enter a bull flag trade is at the time of a breakout above the flag pattern’s upper resistance line. Ideally, you want to wait for the close of the candle over the resistance with greater volume as a confirmation for the breakout.
Place Stop Loss
Place stops just under the lower boundary of the flag or recent swing low. This would minimize the chances of losses in case the pattern fails and keep you out of trouble from false breakouts.
Profit Target
A standard way is to measure the height of the flagpole from the base of that pole, then project that length from the breakout level. For example, if the pole is 20 points high, the profit target will be 20 points higher than the breakout level.
Risk Management
Never put more than 1% to 2% of your trading capital at risk in a single trade. Ensure your risk-to-reward ratios are acceptable (at least 1:2), which will guarantee your success in the long run.
Use Indicators for Confirmation
Use the pattern with RSI, MACD, or Fibonacci retracement levels for additional layers of confirmation, bolstering your trading decisions.
Monitor Market News
Major Financial News or Events can influence the strength of a breakout. Therefore, stay updated with economic calendars and do not participate in trades just before high-impact News.
“Following all the above, you can exploit this great pattern in positive markets for maximum gain and minimized risk.”
Conclusion
The bull flag pattern is a high-probability charting formation indicating the presence of strong bullish momentum. Knowing how to recognize and trade the bull flag can enhance your trading techniques. Whether you are a beginner or an experienced trader, mastery of the bull flag can bring you that winning edge in the market.
While practicing on historical charts, you should always combine the bull flag with appropriate risk management and technical indicators to become a smarter and more profitable trader.
The bull flag pattern may be reliable, yet nothing works 100% of the time. It is wise that you develop a disciplined approach and keep on refining your trading plan.
FAQs
Is the Bull Flag Pattern Suitable for Beginners?
Yes, it is one of the easier patterns to detect and trade. But it’s always better for beginners to trade first and use a small position size.
What does a bull flag have to do with a pennant?
Both continuation patterns exist; one is rectangular, whereas the other hangs a small symmetrical triangle. The price action-and-trading strategy even matches.
Could I use the bull flag pattern for forex trading?
Yes, the bull flag is everywhere stocks, forex, crypto, and commodities as a means of a market signal.
How credible is the bull flag pattern?
One of the more reliable in the series of chart patterns as its signals get confirmed with the use of volume and other indicators. However, there is no assured success with any model.
Which are the best time frames to carry bull flag trades?
It applies to all time frames. However, while day traders may prefer trades for 5 minutes to 1 hour, swing traders would engage such trades only at 4-hour and daily intervals.