Do you know that Analysis of price structures is essential for trading success, especially in bullish markets? It helps you accurately quantify Higher Highs (HH) and Higher Lows (HL), allowing them to trend with confidence and timing on entry and exit. In this article, we will extensively describe various aspects of HH and HL analysis while capturing signs of dynamic structural shifts, as well as CHOCH (Change of Character), leading to better market timings.
How to Accurately Identify Higher High in a Bullish Market
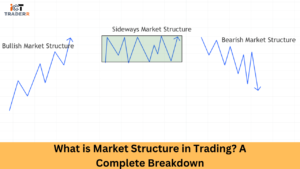
Higher high is said to form when the price of an asset has risen above the previously established high, thereby suggesting a strengthening bullish momentum. It is an indispensable pattern that signals the identification and confirmation of an uptrend. Below is how to accurately spot higher highs:
Identify Significant Price Peaks
Start by locating notable price peaks on your chart. These are points where the price reached a local maximum before declining. For the most accurate analysis, focus on peaks that stand out clearly from surrounding price action.
Compare Sequential Peaks
After spotting these peaks, do a chronological comparison. A new peak above the former peak sets a higher high, indicating the buyers are becoming stronger to push prices higher.
Confirm with Volume
Volume serves as an excellent confirmation tool. A genuine high often comes with increased trading volume, suggesting strong buyer participation and conviction. Lower volume during a higher high might indicate potential weakness in the move.
Use Multiple Timeframes
For robust analysis, confirm higher highs across different timeframes. A higher high that appears consistent across daily, weekly, and monthly charts typically carries more significance than one visible only on shorter timeframes.
How to Accurately Identify Higher Low in a Bullish Market
Higher lows go with higher highs, and they define an uptrend. A higher low is the point where the price doesn’t fall back to the previous point before a bounce up and indicates a diminishing price selling pressure. Here is how to identify them:
Locate Significant Price Troughs
Find notable troughs or valleys in the price chart points where the price reached a local minimum before rising again. These represent temporary periods where sellers had control.
Compare Sequential Lows
Analyze these lows in chronological order. A higher low forms when a new trough remains above the previous one. This suggests buyers are stepping in earlier, preventing prices from falling to previous support levels.
Assess Price Reaction
Pay attention to how quickly and strongly prices react to these lows. Stronger bounces accompanied by strong candlestick patterns like hammers or bullish engulfing patterns support the premise of higher lows.
Market Context Is Important
Higher lows acquire more significance if they line up with other support levels, moving averages, or key technical indicators. Confluence with these elements provides a greater degree of reliability for the bullish continuation signal provided by higher lows.
How to Spot a Structural Low After a Bullish CHOCH: A Step-by-Step Guide
A Change of Character (CHOCH) represents a critical shift in market behavior. Identifying structural lows after a bullish CHOCH can reveal excellent entry points. Follow these steps:
Step 1: Recognize the CHOCH Pattern
Typically, a bullish CHOCH happens whenever the market breaks above resistance after a series of higher lows. This gives a signal to shift from a consolidation or downtrend to a potential uptrend.
Step 2: Wait for the First Retracement
After the bullish CHOCH, wait for the first significant price pullback. This retracement often represents profit-taking after the breakout.
Step 3: Identify Key Support Levels
During the retracement, watch for price interaction with key support levels, including:
- Previous resistance turned into support
- Fibonacci retracement levels (particularly 38.2% and 50%)
- Moving averages (especially the 20-day and 50-day EMAs)
Step 4: Confirm the Structural Low
A structural low typically forms when the price respects these support levels and begins turning upward again. You look for bullish candlestick patterns, positive divergence on momentum indicators, and increasing volume on the bounce to confirm the structural low.
How to Spot a Structural High After a Bullish CHOCH: A Step-by-Step Guide
Identifying structural highs is so important because it shows potential reversal or consolidation points. Here is how to find them:
Step 1: Track the Post-CHOCH Rally
After a bullish CHOCH, monitor how far and fast the price advances. Excessive momentum often leads to exhaustion.
Step 2: Watch for Momentum Divergence
Even if prices are reaching new heights, keep looking for signs of weakening momentum on indicators like the RSI or MACD. Structural highs will be preceded by negative divergence, that is, the price makes higher highs while indicators make lower highs.
Step 3: Identify Overextension Signals
Look for price action that suggests overextension:
- Candlesticks with long upper wicks
- Price touching or exceeding the upper Bollinger Band
- Extremely overbought RSI readings (above 70)
Step 4: Confirm the Structural High
A structural high typically forms when buyers exhaust their momentum and can no longer push prices higher. The confirmation often comes with a reversal candlestick pattern (like a shooting star or bearish engulfing), increased selling volume, and a breach of short-term support.
Conclusion
From Higher Highs to Higher Lows, mastering this skill will allow you to see the market in a different light. With CHOCH, order blocks, and volume analysis at their side, traders can find very good opportunities early. Always remember that market structure is the backbone of all things that move in price. Continuous structure analysis, especially in a highly trending market, will keep you focused on the current trend and help you make better and more confident decisions.
What is the difference between swing high and higher high?
A swing high is any temporary peak in price. A Higher High surpasses the previous swing high, confirming upward structure in a bullish trend.
Can a Higher Low form without a Higher High?
Typically, an HL follows an HH. But in choppy markets, an HL may appear before a confirmed HH, requiring extra confirmation from price action.
How reliable is CHOCH in bullish market analysis?
CHOCH is a strong indication of trend shifts. In bullish markets, a bullish CHOCH often hints at a reversal from a temporary bearish phase or accumulation before markup.
Which timeframe is best for identifying HH and HL?
The 4-hour and 1-hour timeframes offer a good balance between clarity and trade opportunity. However, the daily chart provides stronger confirmation for swing traders.