In the world of smart-money trading (SMT), one term that remains of great curiosity to both amateur and professional traders is ICT SMT Divergence. The phrase stands for Inner Circle Trader’s Smart Money Technique Divergence, and it becomes crucial to those who use price action and institutional order flow to come to conclusions about trading decisions.
In this blog post, we will cover everything from the basic meaning of SMT divergence to how it integrates with your forex trading strategy. Whether you are just starting out or already have trading experience, this guide will serve as your go-to resource for mastering SMT divergence in ICT trading.
What is SMT Divergence in ICT Trading?
SMT Divergence, also known as Smart Money Technique Divergence, is a price action-based difference between currency pairs or assets that are correlated. It is a market condition where two or more correlated instruments behave differently, often revealing hidden footprints of institutional or smart money moves.
ICT (Inner Circle Trader), founded by Michael J. Huddleston, emphasizes the importance of price manipulation, liquidity grabs, and market maker behavior. SMT divergence plays an important role in identifying these manipulations before the crowd catches on.
Example:
Let’s we say that there is a positive correlation between EUR/USD and GBP/USD. If EUR/USD creates a higher high while GBP/USD fails to do the same, or even creates a lower high this can be interpreted as a bearish SMT divergence, suggesting a potential reversal or sell opportunity.
Core Concept Behind SMT Divergence
At its core, SMT divergence is about detecting institutional order flow. Retail traders often chase breakouts or rely solely on lagging indicators. On the other hand, ICT ideas encourage traders to “think like the banks.”
Here’s how SMT divergence works:
- It compares any two correlated pairs, EUR/USD and GBP/USD, or NASDAQ and S&P 500.
- It identifies divergent price structures, one pair makes a new high/low while the other does not.
- It exposes false breakouts or liquidity grabs engineered to trap retail traders.
The idea is that smart money won’t push all correlated assets in the same direction simultaneously. Recognizing this disparity gives you a strategic edge in entering or exiting trades before major moves occur.
Look for Liquidity Pools being targeted on one pair but not the other.
Tools Needed to Spot SMT Divergence
To effectively identify and trade with SMT Divergence, you will need specific tools and indicators:
Essential Indicators
- Relative Strength Index (RSI): The most commonly used indicator for spotting divergence (14-period setting is standard)
- Moving Average Convergence Divergence (MACD): Excellent for confirming divergence signals
- Stochastic Oscillator: Helpful for identifying overbought/oversold conditions alongside divergence
Charting Requirements
- Access to Multiple Timeframes: The capacity to simultaneously analyze both higher and lower timeframes
- Clean Price Charts: Preferably candlestick charts without excess indicators
- Advanced Charting Platform: Trading View, MT4/MT5, or similar platforms with drawing tools
Additional ICT Tools
- Order Block Identification Tools: To mark institutional entry and exit points
- Liquidity Sweep Detector: Stop hunts and liquidity grabs can be identified using a liquidity sweep detector.
- Market Structure Analysis Tools: To identify shifts in market structure
Trading platforms like MetaTrader and TradingView provide all the necessary tools, though you may need to create custom templates to efficiently spot SMT Divergence patterns. Some traders develop specialized indicators specifically for the ICT methodology application.
Types of SMT Divergence
There are two main types of SMT divergence.
1. Bullish SMT Divergence
Occurs when:
- One pair makes a lower low
- The correlated pair does not make a lower low
This signals that the move down might be a liquidity grab, and the market is likely to move higher.
Example:
- EUR/USD makes a lower low
- GBP/USD makes a higher low
→ Potential long-term opportunity
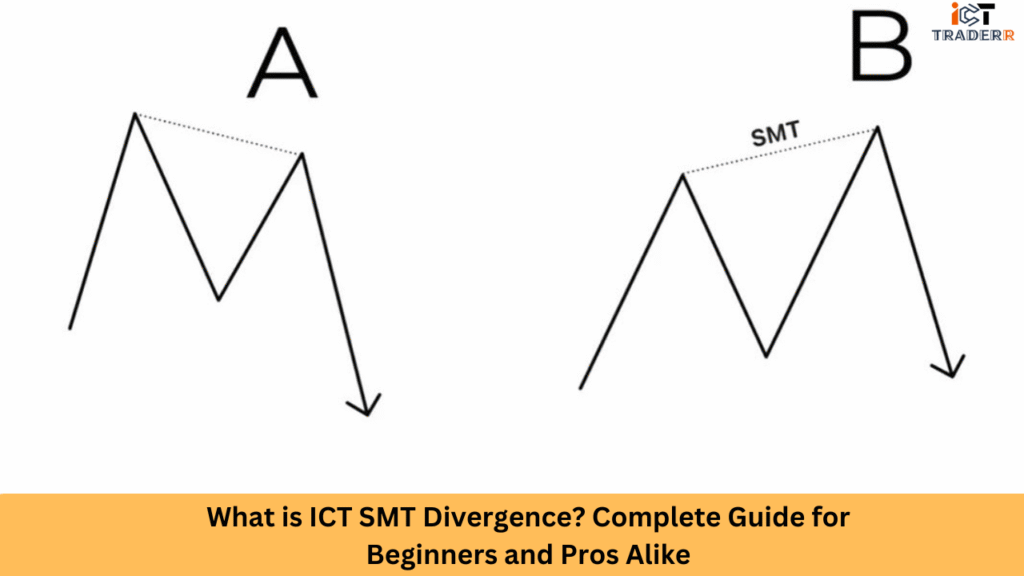
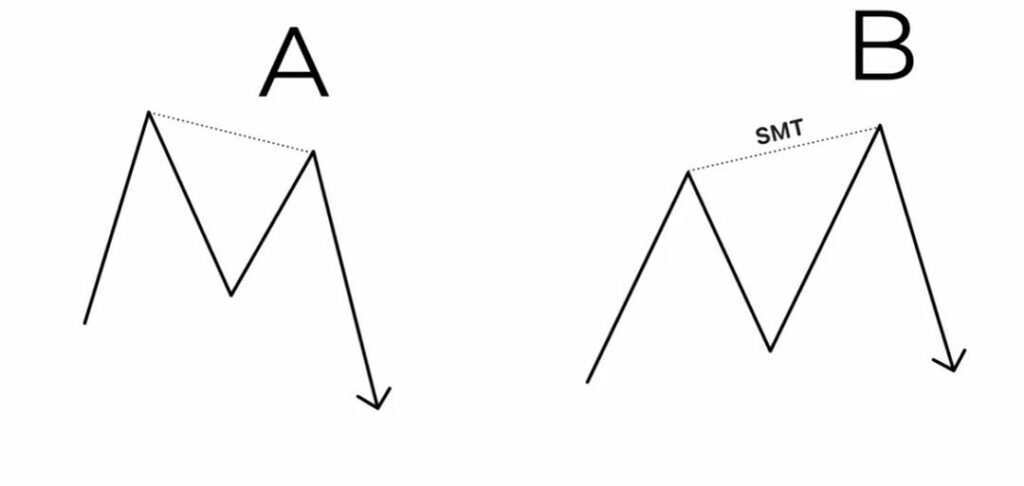
2. Bearish SMT Divergence
Occurs when:
- One pair makes a higher high
- The other fails to do so (or creates a lower high)
This suggests that the high might be a manipulated breakout, and the price may reverse downward.
Example:
- NASDAQ makes a higher high
- S&P 500 fails to make a higher high
→ Potential short setup
How to Use SMT Divergence in a Trading Strategy
Implementing SMT Divergence within your trading approach requires a systematic methodology:
Step 1: Market Structure Analysis
Before looking for divergence, identify the current market structure:
Determine if the market is in an uptrend, a downtrend, or a range
Identify key swing highs and lows
Mark potential order blocks and fair value gaps
Step 2: Divergence Identification
Scan for divergence between price and your chosen oscillator (typically RSI)
Confirm divergence across multiple indicators if possible
Prioritize divergence that appears near significant market structure points
Step 3: Entry Strategy
Wait for confirmation candles after divergence appears
Look for additional ICT concepts to align (liquidity sweeps, breaker blocks)
Enter trades with tight stop losses placed beyond relevant swing points
Step 4: Risk Management
Limit position risk to one to two percent of trading capital.
Stops should be placed beyond relevant Order Blocks or swing points.
Consider partial profit-taking at previous market structure points
Step 5: Advanced Applications
Combine divergence with order flow analysis
Use Market Structure Shifts (MSS) to validate divergence signals
Implement multi-timeframe confirmation for higher probability trades
Remember that SMT Divergence should not be used in isolation but as part of a comprehensive trading approach that includes proper risk management and understanding of the broader market context.
Best Pairs for ICT SMT Divergence
While SMT Divergence can be applied to any market, certain currency pairs and instruments tend to respect these patterns more consistently:
Major Currency Pairs
- EUR/USD: The high liquidity and institutional participation make divergence signals particularly reliable
- GBP/USD: Often displays clear divergence patterns near significant support/resistance levels
- USD/JPY: Excellent for divergence trading during periods of risk sentiment shifts
Cross Pairs
- EUR/JPY: Known for strong trending movements where hidden divergence works exceptionally well
- GBP/JPY: Volatile nature creates frequent divergence opportunities
- AUD/CAD: Often shows extended divergence patterns during commodity price fluctuations
Timeframe Considerations
- Daily and 4H: Most reliable for major reversal signals
- 1H: Useful for entry timing once higher timeframe divergence is identified
- 15M: Can provide precision entries, but should only be used with higher timeframe confirmation
The ideal timeframe combination involves identifying divergence on higher timeframes (Daily/4H) and using lower timeframes (1H/15M) for precise entry execution, maximizing both reliability and risk-reward ratio.
Conclusion
ICT SMT divergence is a powerful technique that traders use to decode smart money manipulation and improve trading precision. By understanding the price action difference between correlated assets, the trader can have the edge against false breakouts, liquidity traps, and trading with institutional flow.
Remember that the markets are constantly evolving, and successful traders adapt their strategies accordingly. The principles of SMT Divergence remain relevant because they reflect the fundamental relationship between institutional positioning and market movement – a relationship that continues to drive price action across financial markets.
FAQs
Is SMT Divergence the same as RSI or MACD divergence?
No, SMT divergence is based purely on price action across correlated assets, not indicators.
Can I use SMT divergence in crypto markets?
Absolutely! Correlated crypto pairs like BTC and ETH are ideal for spotting SMT divergence patterns.
Is SMT divergence suitable for beginners?
Yes, but it requires basic knowledge of price action and ICT concepts to use effectively.
How accurate is SMT divergence?
While no strategy is 100% accurate, when used with proper confluence and risk management, SMT divergence offers high-probability trade setups.
Do I need premium tools to spot SMT divergence?
No. Free tools like TradingView and proper education are sufficient to get started.