When you dive into ICT (Inner Circle Trader) strategies, you will often hear about swing highs. These are pivotal points in a trend, and understanding them helps you think like the big players—smart money.
In this article, you will learn what an ICT swing high is, how to spot it, why it matters, see a real trade example, and avoid common mistakes.
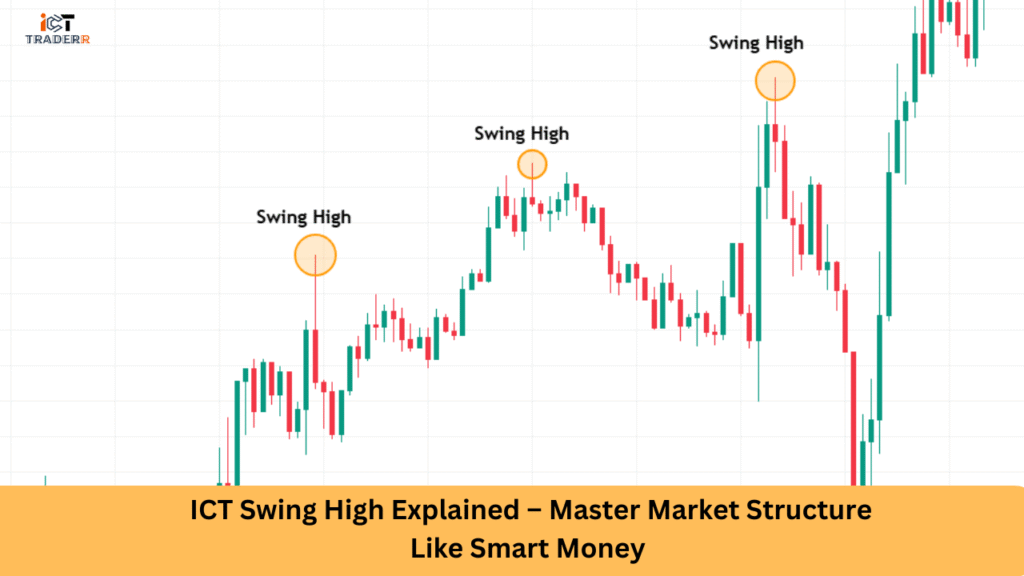
What Is a Swing High in ICT?
A swing high is a clear peak in price where the market briefly reverses after moving up. In ICT terms, it’s more than a random top—it’s a structural point that shows institutional interest.
You can think of it like this: smart money doesn’t just push the price up continuously. Instead, it creates recognizable patterns—like swing highs—before making a bigger move. These highs reveal areas where price tested resistance and smart money could trigger stops or liquidity hunts.
When you learn to detect these swing highs, you position yourself with the institutions, not against them.
How to Identify a Valid ICT Swing High
To mark a valid swing high, keep your eyes on three things:
- Structure Context
First, confirm that the price has been in a noticeable uptrend or range. An ICT swing high is meaningful when it appears within a defined structure, not randomly bouncing around. - Candlestick Clarity
Look for a candle with a pronounced upper wick or body, surrounded by at least two lower highs on each side. This shows price tried higher levels and then dropped back, creating a recognizable peak. - Higher Timeframe Confirmation
ICT teachings emphasize aligning multiple timeframes. If your H4 or Daily chart shows a similar peak at the same level, your Swing High is stronger. Smart money loves stacking orders and liquidity around those deeper timeframe zones.
When scanning charts, focus on price action that matches specific criteria, rather than any top you might want.
Why Swing High Matters in Smart Money Concepts
Knowing your swing highs gives you insight into where institutions might be planning their next move:
- Liquidity Pools: Smart money hunts above swing highs to trigger stop-loss orders. When you see a price spike above and reverse, you’re witnessing that run for liquidity.
- Structure Break & Re-Test: A true smart money signal often follows a break of structure, then price re-tests the swing high after flipping it into resistance. That’s your ideal entry zone.
- Trend Continuation or Reversal: Swing highs help you read the bias. If price fails to break a swing high and starts making lower lows, you may be seeing a trend reversal. If it breaks, the uptrend might be continuing, with another swing being formed later.
By using swing highs, you align your trades with the institutional flow, not retail noise.
Real Trade Example Using Swing High
Let’s walk through a simplified example in today’s market:
- Set Your Context
On the 4‑hour chart, the price has been climbing slowly. You spot a recent high where price paused and reversed sharply—that’s your swing high. - Wait for Break & Re-Test
After a push higher, the price breaks above your identified swing high, takes out stops, then drops back. It approaches the same level again, now acting as resistance. - Refine Entry
Around that retest, you see a bearish engulfing candle or a pin bar refusing to close above the swing high. That’s your signal: short entry just under the swing high. - Manage the Trade
You place your stop a few pips above the swing high to protect against fakeouts. Your target? The next reasonable support zone or the next swing low. - Ride the Move
As price moves lower, you might trail your position or lock in partial profits at dynamic support levels.
This is exactly how smart money builds high probability short setups—by targeting liquidity, structure, and pattern confluence.
Mistakes to Avoid
Even with swing highs, beginners often slip up. Here are some traps to dodge:
- Jumping In Too Early
Reacting to the first test of the swing high instead of waiting for a clear retest often leads to being stopped out by volatility. - Ignoring Bigger Timeframes
If your daily chart is bearish, yet you’re trying long entries around minor 1-hour swing highs, you’re fighting smart money. - Poor Stop Placement
Putting stops tight without considering volatility and structure gives wild stop‑hunts more opportunity to grab you. - Volume Blindness
A swing high tested without lower volume or clear order flow signals might just be market noise. Smart money often shows interest by volume clusters, wick reactions, or institutional footprint candles.
Avoiding these errors helps you trade cleanly and keep more profits.
Conclusion
You now have a real understanding of ICT swing highs: what they are, how to spot them, why they matter, how to trade them in real time, and what pitfalls to avoid. Using swing highs puts you in line with smart money, empowering you to build more consistent trade entries, manage risk better, and truly “master market structure.” The next time you chart price, look for those peaks—and let them guide your decisions.
FAQs
Can a swing high form during consolidation?
Yes, but those are weaker. For strong ICT setups, look for swing highs within clear trend structure, not random sideways action.
How many candles define a swing high?
Ideally, you want at least two lower highs on each side. But the more timeframes that agree, the stronger the signal.
Are swing highs useful for long trades, too?
Absolutely. Just flip the concept: in a downtrend, watch for swing highs breaking and re‑testing as resistance for short opportunities. For longs, you’d focus on swing lows and their retests.
What tools help detect swing highs faster?
While manual identification is best, using horizontal lines or programs that mark higher highs can speed things up—just don’t rely on them alone.
By following this strategy, you’ll analyze the chart like a pro. Keep it simple, stay patient, and soon you’ll be spotting ICT swing highs and trading them confidently with smart money precision.