In forex trading, understanding how big players—often called “smart money”—manipulate liquidity can give you a powerful edge. Two key concepts in the ICT (Inner Circle Trader) toolkit are the High Resistance Liquidity Run (HRLR) and the Low Resistance Liquidity Run (LRLR). By mastering these, you can craft smarter entries, set clearer targets, and feel confident in your trading decisions.
Understanding Liquidity in ICT Trading
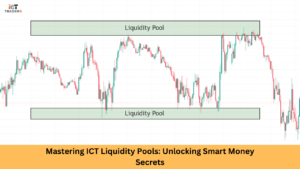
First, let’s get clear on liquidity. In trading terms, it’s where orders are piled up—common places like swing highs/lows or classic market structure points. Price is drawn to these areas to trigger active orders, and then often reverses. So, when you spot liquidity zones, you’re seeing where smart money is hunting for those stops or fills.
What Is HRLR (High Resistance Liquidity Run)?
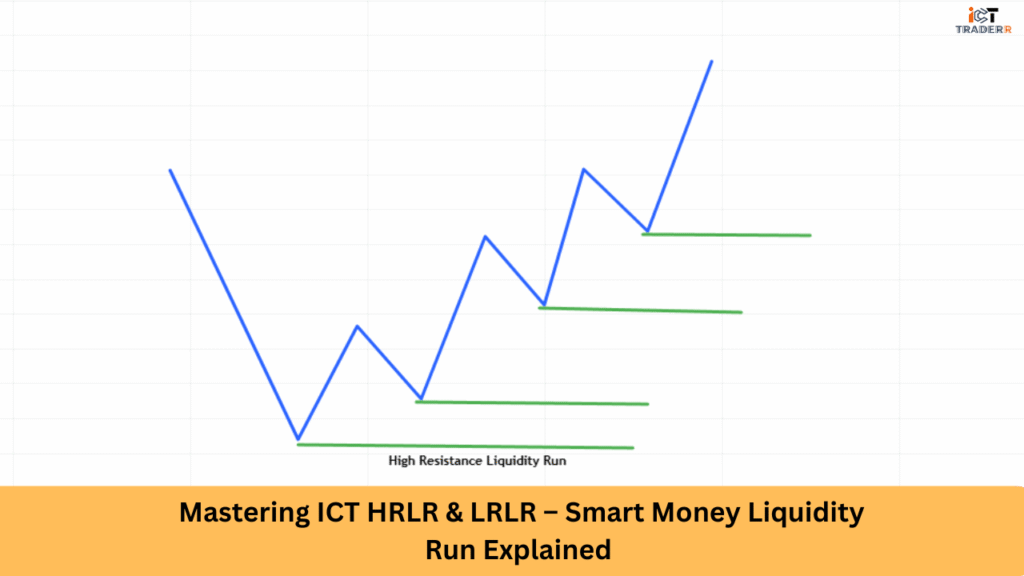
High Resistance Liquidity Run, or HRLR, happens when the price has to work hard to reach liquidity. Imagine driving through congested areas with traffic jams—each swing high or low slows you down. These zones are defended strongly, so price crawls up or down, often forming mini pullbacks or wicks along the way. HRLR typically plays out like this:
- Multiple swing levels cluster, acting as resistance
- Price moves slowly, with choppy action.
- It often needs news catalysts—like NFP or FOMC—to punch through.
- Better left for patient traders with longer timeframes
What Is LRLR (Low Resistance Liquidity Run)?
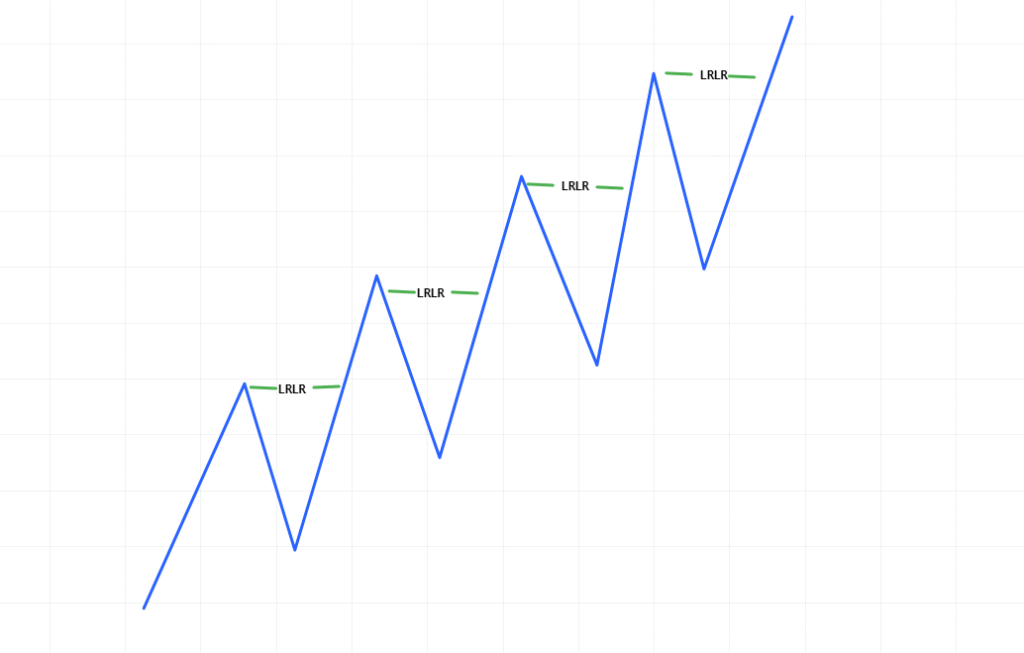
In contrast, Low Resistance Liquidity Run (LRLR) is like taking the expressway—there’s little blocking your way. Here, price zips through minor liquidity levels after a breakout, leaving behind fair value gaps or liquidity voids. Highlights of LRLR:
- Few swing highs/lows in the path = minimal resistance
- Fast, often sharp moves aligned with the trend.
- Clean high‑probability setups you can trade confidently
How Smart Money Exploits HRLR & LRLR Zones
Smart money loves targeting liquidity. In HRLR zones, they accumulate orders, stirring chop and uncertainty, which triggers retail traders’ stops. Then a big move sweeps through all the stops. Conversely, in LRLR zones, they can trigger a breakout, quickly take liquidity, and ride the move while leaving behind price inefficiencies. On the retail side, buyers/sellers get trapped, and smart money profits on the sharp move.
How to Identify HRLR & LRLR Zones in Real Charts
Here’s what you should look for, chart by chart:
- HRLR Zones
- Clustered swing highs or lows are tightly packed.
- Choppy climbs or declines; candles with wicks
- Often preceded by minor liquidity sweeps or stop-hunting behaviour.
- Clustered swing highs or lows are tightly packed.
- LRLR Zones
- Breakout beyond recent swing high/low
- Sharp, clean candles with minimal retracement
- Fair value gaps—spaces where the market skipped trading
- Breakout beyond recent swing high/low
To improve your detection, examine the 50–200‑period range on higher timeframes (H1, H4) and then zoom into M15 or M5 to pinpoint the runs. Many high-ranking forex sites also stress the role of fair value gaps, order blocks, and market structure shifts as confirmation points.
Entry Models Using HRLR & LRLR (With Confluences)
Let’s break down you-focused entry models based on smart trading practices:
- LRLR Breakout Entry
Wait for a clean break of a minor swing high/low. As price clears it fast, enter in the direction of the move, placing a stop just below/above the breakout candle. Target next swing or fair value area. - HRLR Rejection Entry
Spot a price struggle at an old high/low with congested swing levels. Look for a wick rejection or bearish/bullish candle. Enter on confirmation of rejection. You’ll need patience and wider stops since the price tends to chop. - Hybrid Confluence Setup
Let LRLR break get you in, then check a higher‑timeframe HRLR zone as a take-profit area. You get momentum entry and a realistic target.
Make sure to tie in other confluences like volume, news filters, order blocks, or Fibonacci zones. Many top traders blend these tools for a higher probability.
Best Timeframes & Trading Sessions for HRLR & LRLR
- LRLR fits best on M15–H1 timeframes, where you see momentum more clearly.
- HRLR plays out better on H1–H4 charting due to slower price action.
- Time your trades in relevant sessions—London and NYC sessions generally show stronger EUR, GBP, USD moves and produce better liquidity runs.
Tip: Look at high-impact economic news schedules. HRLR often coincides with NFP, FOMC, or CPI releases, offering the push needed to break through strong zones.
Conclusion
Both HRLR and LRLR are powerful tools in your ICT strategy toolbox. Knowing when to go for the fast-paced LRLR and when to wait out a slow HRLR can level up your entry timing, stop placement, and profit targeting. Blend them with other signals—such as Fair Value Gaps, order blocks, volume, and confirmation candles—to craft setups with a real edge. Your charts will thank you, and so will your win rate.
FAQs
Which one should I use more?
If you like quick, clean moves, focus on LRLR. HRLR is better if you don’t mind slower plays and chasing news-driven breaks.
Can I trade HRLR without news events?
Sometimes, yes. However, HRLR often requires fuel from major events. Without that, the price may chop and fail.
Do these apply in other markets?
Absolutely—stocks, crypto, commodities. The dynamics of liquidity runs remain the same.
How to set stop-loss and take-profit?
For LRLR, your stop goes just beyond the breakout candle, profit near the next swing or fair value zone. For HRLR, consider placing a stop beyond the defended cluster and taking targets at news-breakout zones.
Can I automate these setups?
Yes, many traders add ICT-based indicators to MT4/MT5 or TradingView—like HRLR/LRLR indicators—to flag zones and gaps.