As you know, buying or selling commodities in the financial markets requires a combination of knowledge, experience, and the right tools. One such tool that has gained popularity among price action traders is Candle Range Theory (CRT). Whether you are a beginner or an experienced trader who wants to refine your stretegy or her approach to trading markets, learning CRT can give you an edge to make it in the market.
In this article, we will discuss CRT-from entry-level concepts to cutting-edge techniques-and show you the extent of your ability to detect high-probability trade setups in the market by using candle ranges.
Understanding Candlestick Patterns
Before taking a deep dive into Candle Range Theory, we must understand the basis of this theory, candlestick patterns. A candlestick is a representation of four important pieces of data of the market-the opening price, closing price, highest price, and lowest price-for a set time interval.
These candles can indicate bullish or bearish sentiment depending on the open and close relationship. Such formations are then used among traders to try and read market psychology and possible reversal points or continuation patterns.
What is Candle Range?
It’s the full distance price, from high to low of a single candlestick. It describes everything that has happened during the particular period between prices moving up and down, reflecting their volatility and strength.
A large candle range often indicates strong buying or selling pressure.
Due to a narrow range of activity, the candle indicates uncertainty or consolidation in the market.
These range patterns could give you clues as to future possible activity in the market.
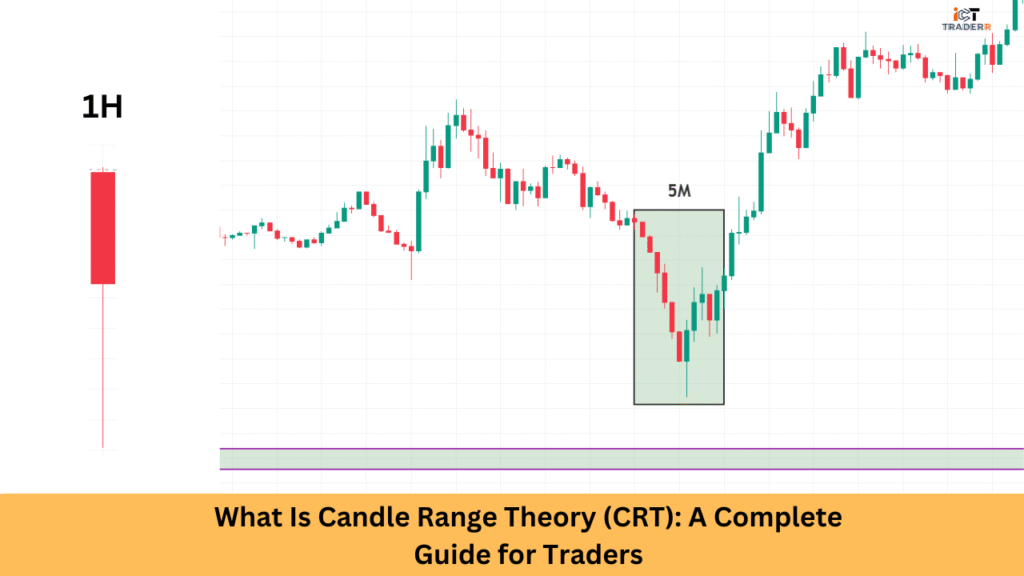
What is Candle Range Theory (CRT)?

Candle Range Theory (CRT) is a trading methodology that takes into account the size, position, and series of candlesticks in order to predict price movements. Price action within some ranges of candles gives future clues regarding breakout, reversal, or trend.
CRT doesn’t rely on lagging indicators instead, it observes live market structure and momentum. This theory blends seamlessly with support and resistance analysis, helping you develop accurate entries and exits.
CRT is particularly effective for:
- Day trading strategies
- Swing trading setups
- Identifying fakeouts and real breakouts
Bullish Candle Range Setup: Catching the Uptrend
A bullish CRT setup begins when a large bullish candlestick forms after a period of small or indecisive candles.This suggests that buyers are in charge and that momentum is moving in the right direction.
Key signs of a bullish candle range setup:
- The bullish candle closes near its high
- Breakout above the resistance or the consolidation range
- .That follows with a confirmation by the following candle or candles.
- Confirmation by higher volume (optional but ideal)
This setup is best used near support zones or after a trendline breakout, allowing traders to ride the uptrend while maintaining a favorable risk-reward ratio.
Bearish Candle Range Setup: Capitalizing on the Downtrend
Alternatively, a bearish CRT forms when evidence suggests that a strong bearish candlestick follows a consolidation or failed bullish breakout, suggesting that sellers are overpowering buyers, and the price will be continued in a downward direction.
Characteristics of a bearish candle range setup:
- Long red candle closing near its low.
- Breakdown below the support or trendline
- Absence of bullish follow-through
- Often seen after a double top or failed breakout
You can use this setup to enter short positions and capitalize on the downtrend, especially when paired with technical confluences like moving averages or Fibonacci retracements.
High-Probability CRT Setups: How to Spot Them
Thus, to increase the chances of success, filter out weak signals so that you can focus your attention on CRT setups that have greater potential for success. Here are some ways to spot strong CRT patterns:
- Combine with key levels: Look for CRT setups near significant support or resistance levels. These areas often attract institutional interest.
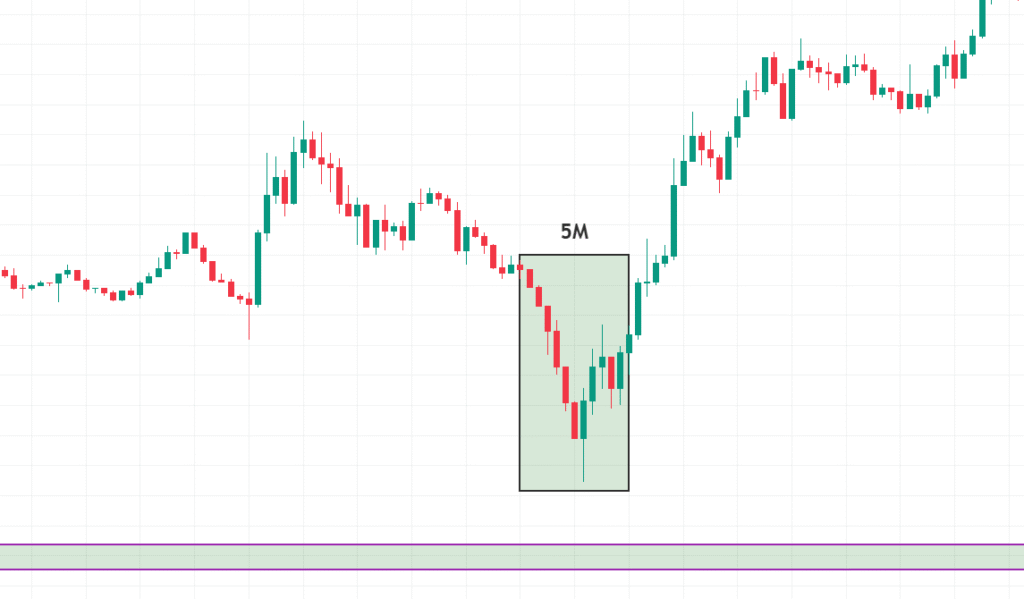
- Use multiple timeframes: A CRT setup on the 4H chart confirmed by the 1H chart adds credibility.
- Watch for volume confirmation: A strong candle with rising volume indicates real interest in that direction.
- Look for structure shifts: CRT works best when the market is showing a clear change in trend or breakout structure.
By integrating CRT with traditional technical analysis, you can build more effective and disciplined strategies.
Conclusion
Candle Range Theory (CRT) is considered a great tool for traders using price action. By analyzing candle ranges, breakouts, and trend confirmations, one can locate high-probability setups. Understanding the expanding nature of price movements within their corresponding candle ranges helps you establish possible turning points and trend continuations ahead of time.
As with all trading approaches, the best results include combining it with remaining technical analysis tools, accompanied by good risk management. The actual power comes from understanding how the candle ranges reveal underlying market psychology and applying it to make intelligent trading decisions.
“ Backtesting and applying CRT to your charts will help you refine your strategy. Happy trading!”
FAQs
Is Candle Range Theory suitable for beginners?
Yes, CRT is relatively easy to learn and works well with basic candlestick knowledge, making it ideal for beginners.
Can I use CRT on any trading asset?
Certainly. CRT is applicable for Forex, stocks, crypto, and even commodities as long as there is candlestick data on them.
What makes CRT different from other trade strategies?
CRT focuses solely on price action and candle ranges, making it faster and more reliable than lagging indicators.
What is the best timeframe to use CRT?
You can use CRT on any timeframe, but 1H, 4H, and daily charts often yield higher accuracy.
Should I use indicators with CRT?
While not required, some traders combine CRT with volume, RSI, or moving averages for extra confirmation.