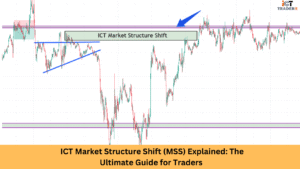
Market structure is vital to informed trading decisions, especially smart money concepts. Market structure, or, better, the identification of Short-Term Highs (STH), Intermediate-Term Highs (ITH), and Long-Term Highs (LTH) plays a major role in the ICT (Inner Circle Trader) methodology. These highs matter whether you are day trading or swing trading, as they tell you a lot about price action, potential reversals, and institutional behavior.
So, let’s define these terms and explore how you will use them to elevate your trading strategy.
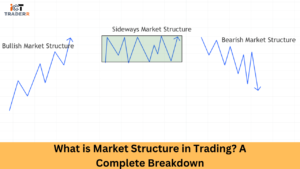
What Is Market Structure?
In other words, market structure is nothing but the pricing actions by which price moves from one point to another, producing higher highs, higher lows, lower highs, and lower lows. Both higher and lower are categorized based on performance. Market structure is related to the ICT concept since the latter provides a map for a trader to interpret market flow trends and predict future price action.
Smart Money leaves a trail in the structure. Therefore, you find these footprints in terms of STH, ITH, and LTH to understand where the market was manipulated, where liquidity was taken, and where institutional orders are likely to be placed.
What Is STH (Short-Term High)?
An STH or Short-Term High is the most immediate and minor swing high formed in the market. These highs are often targeted for liquidity by institutions or market makers.
Key Characteristics of STH:
- Formed within a day or intraday session.
- Typically broken easily due to low resistance.
- Used as a liquidity pool or a trap for retail traders.
Practical Example:
Imagine you’re watching a 15-minute chart. Price spikes up to form a minor high before retracing. This minor high becomes your STH, often taken out by smart money to trigger buy stops before reversing.
What Is ITH (Intermediate-Term High)?
An ITH or Intermediate-Term High is more significant than an STH and usually spans over multiple trading days. It marks a key resistance area and indicates stronger market participation.
Key Characteristics of ITH:
- Visible on higher timeframes like 1H or 4H charts.
- Often represents reaction zones for price reversals.
- Traders watch ITH to confirm shifts in market direction.
Usage Tip:
ITHs help in identifying support and resistance areas. If price breaks an ITH and holds above, it can be a bullish sign, indicating a market structure break in the upward direction.
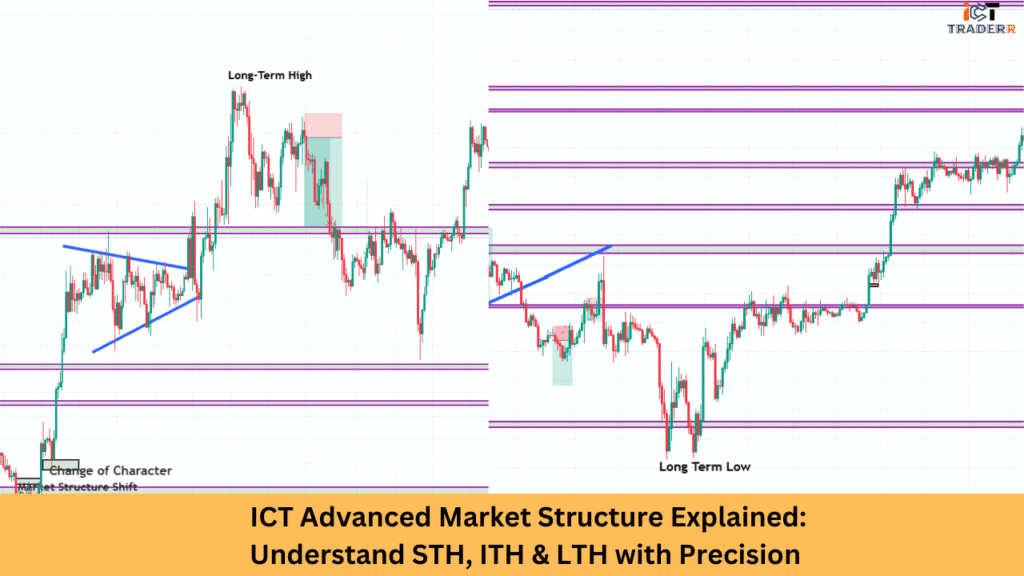
What Is LTH (Long-Term High)?
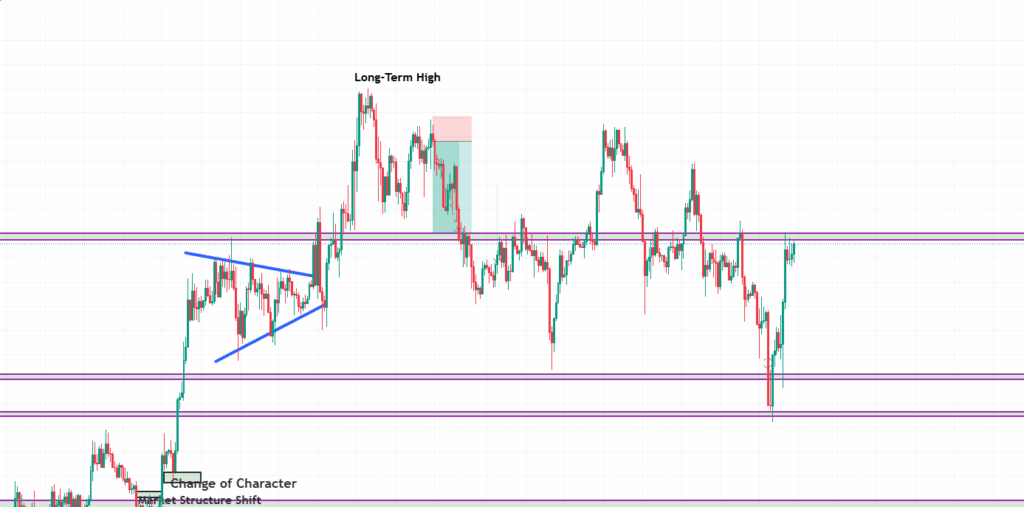
The LTH or Long-Term High is the highest and most significant swing point, typically formed over weeks or even months. This height represents a major institutional interest zone.
Key Characteristics of LTH:
- Found on daily or weekly timeframes.
- Represents macro-level resistance.
- Crucial for long-term market bias and trend analysis.
LTH is rarely touched, and when broken, it signals a significant market shift. Long-term investors and position traders closely monitor LTH for entries and exits.
How to Use These Highs in Real Trading
Understanding STH, ITH, and LTH is not just about identifying points on a chart it’s about aligning with the smart money narrative. Here’s how to use them effectively:
- Liquidity Hunts: STHs are often taken out in stop hunts. Enter trades after liquidity is taken and confirmation candles form.
- Trend Confirmation: ITH breaks can signal a mid-term trend shift. Use this to either hold your trades longer or scale in.
- Bias Formation: Use LTH to define the overall market trend. For example, if the price is constantly making higher LTHs, the market is bullish.
- Confluence with Order Blocks: Pair these highs with ICT order blocks for precision entries.
Most Common Mistakes New Traders Make
New traders often misunderstand market structure or misidentify highs. Here are some frequent pitfalls:
- Confusing STH with ITH: This leads to false entries and poor stop-loss placement.
- Ignoring Timeframes: Not using multiple timeframe analysis can cause misjudging the importance of a high.
- Overtrading STHs: Beginners often chase small highs, expecting big moves.
- Lack of patience: Market structure takes time to form. Impatience leads to premature trades and losses.
To avoid these mistakes, always align your trade setups with the overall market structure and ensure proper risk management.
Conclusion
Understanding STH, ITH, and LTH within the ICT market structure framework is essential for any serious trader. These highs act as road signs, helping you navigate through the noise and align with smart money. When used correctly, they offer a competitive edge in both entry precision and trade management.
Whether you are a scalper or a position trader, integrating these elements with price action, order blocks, and liquidity concepts can dramatically improve your success rate.
FAQs
Can I use STH, ITH, and LTH on all timeframes?
Yes. However, their significance increases on higher timeframes. Use them in combination with your trading style.
What is the difference between ITH and a regular resistance level?
While both can act as resistance, ITH specifically forms as part of the ICT structure with deeper institutional implications.
How do I identify an STH in real time?
Look for the most recent swing high followed by a retracement on intraday charts like 15M or 1H.
Are these highs applicable to forex only?
No. These concepts apply to all markets — forex, stocks, crypto, and commodities.