In the fast-paced world of forex trading, ICT (Inner Circle Trader) daily bias has emerged as a key concept for traders looking to refine their market entries and improve accuracy.
In this article, we will walk you through everything you need to know about ICT daily bias, from its formation to real-world application, empowering you to make better, more informed trading decisions.
What is ICT Daily Bias?
ICT Daily Bias refers to a trader’s directional expectation of the market for the day—bullish, bearish, or neutral. It is a prediction based on price action, liquidity levels, and institutional order flow, helping you align with the smart money.
The ICT concept revolves around how big financial institutions operate. By understanding their movement, retail traders can gain a critical edge in their decision-making. Daily bias acts as your trading compass, guiding your trades in the direction of higher probability setups.
How ICT Daily Bias Is Formed
Forming ICT daily bias is a multi-step process that involves:
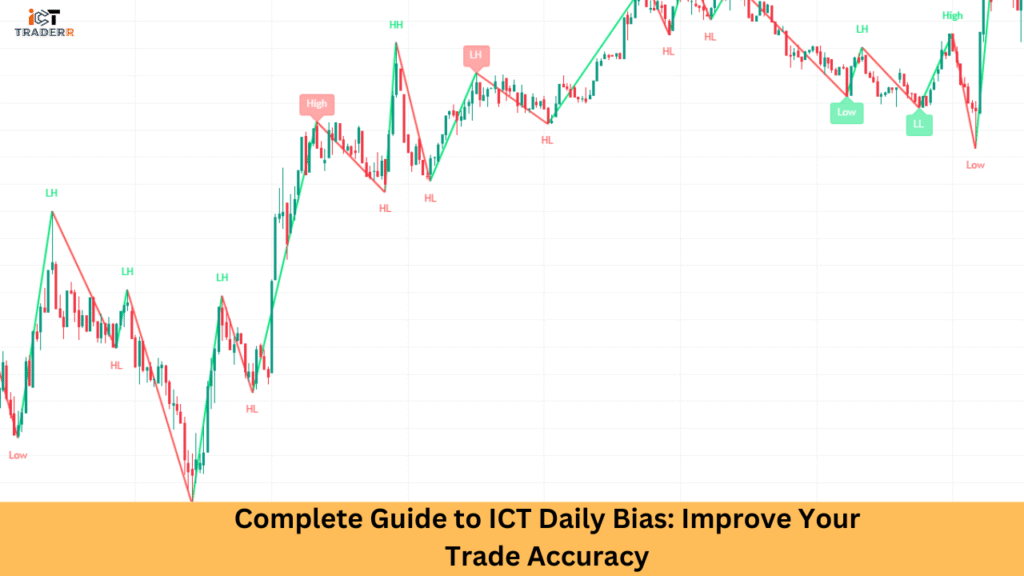
- Market Structure Analysis Identify if the market is in a bullish or bearish trend using swing highs and lows.
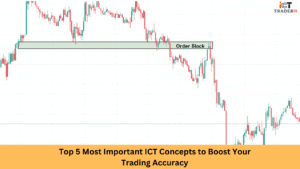
- Key Levels and Liquidity: Observe where liquidity pools are formed (equal highs/lows, fair value gaps).
- Previous Day’s Price Action: Study how the price behaved in the prior session. Did it sweep liquidity? Was there a shift in structure?
- Economic Events: Major news can heavily influence bias. Use tools like the economic calendar to stay updated.
- Time of Day Analysis: The London and New York sessions are key when assessing price delivery.
By evaluating these aspects together, you can anticipate the day’s most likely price direction.
Bullish ICT Daily Bias: Signs & Setup Example
Recognizing bullish daily bias requires understanding specific price action signals and market structure characteristics. These signs help you identify when institutions are positioning for upward price movement.
Key Bullish Signs:
- Price creating higher highs and higher lows on higher timeframes
- Break of structure (BOS) to the upside with strong momentum
- Liquidity sweep below recent lows, followed by a quick recovery
- Accumulation patterns near significant support levels
- Positive divergence between price and momentum indicators
Practical Setup Example: Consider the EUR/USD trading scenario where the price approaches the previous day’s low during the Asian session. Instead of breaking lower, the price forms a hammer candlestick pattern with high volume, indicating potential buying interest. During the London session opening, price breaks above the Asian session high with strong momentum, confirming bullish bias.
Entry strategy involves waiting for a pullback to the breaker block (previous resistance turned support) and entering long positions with stops below the invalidation level. Profit targets align with previous highs or significant resistance zones identified through institutional order flow analysis.
Risk management becomes crucial in bullish bias scenarios. You should use proper position sizing and trail stops as price moves in their favor, allowing profits to run while protecting capital during potential reversals.
Bearish ICT Daily Bias: Signs & Setup Example
Bearish daily bias identification follows similar principles but focuses on downward pressure indicators and institutional selling activity. These patterns help you capitalize on declining market conditions.
Key Bearish Signals:
- A series of lower highs and lower lows on relevant timeframes
- Breakdown of structure to the downside with increasing volume
- Liquidity grab above recent highs, followed by sharp selling
- Distribution patterns near resistance levels
- Negative divergence patterns suggesting weakening bullish momentum
Practical Setup Example: In a GBP/USD bearish bias scenario, price rallies during overnight trading but fails to break above the previous day’s high. During the London session, selling pressure emerges as the price breaks below the Asian session low with strong volume. This confirms bearish sentiment for the trading day.
Entry opportunities arise when price retraces to the order block (previous support turned resistance) or the fair value gap created during the initial decline. Short positions with stops above invalidation points and targets at significant support levels or liquidity pools provide favorable risk-reward ratios.
Professional traders often scale into bearish positions as confirmation develops, managing risk through proper stop placement and position sizing techniques aligned with institutional trading methodology.
ICT Daily Bias vs Weekly Bias
While daily bias looks at intraday directional flow, ICT weekly bias provides a broader context. Weekly bias identifies the macro-level direction the market is likely to move across the week.
- Use Weekly Bias to frame the larger picture.
- Daily Bias helps you fine-tune entries and exits for the day.
When both biases align, the trade setup becomes high-probability. For example, a bullish weekly bias paired with a bullish daily bias offers stronger confirmation to go long.
How to Use ICT Daily Bias in Actual Trading
Integrating ICT daily bias into your trading plan requires discipline and routine. Here’s how:
Pre-market Analysis: Each morning, identify potential liquidity areas and order blocks.
Align Entries with Bias: Only take trades in the direction of your bias unless clear reversal setups form.
Session Timing: Execute trades during high-volume sessions (London/New York) when smart money operates.
Risk Management: Never force a trade just to follow the bias. Stick to your trading plan and manage risk wisely.
By using ICT daily bias in this structured way, you can dramatically improve trade accuracy and consistency.
Common Mistakes While Using Daily Bias
Even experienced traders can misuse the daily bias. Watch out for these common pitfalls:
- Overconfidence in Bias: Market conditions change. Be flexible if price action invalidates your bias.
- Ignoring Market Structure: A proper understanding of structure is crucial. Don’t base a bias on just one signal.
- Forcing Trades: If no clear setup appears, stay out. Patience preserves capital.
- Neglecting Time-of-Day Sensitivity: ICT trading is time-based. Know when liquidity is injected.
Avoiding these mistakes can be the difference between consistent wins and frustrating losses.
Conclusion
ICT daily bias is a powerful tool when used correctly. It helps you forecast market direction, spot high-probability setups, and avoid random trades. Whether bullish or bearish, the key is combining bias with institutional concepts, such as liquidity grabs, fair value gaps, and order blocks.
For best results, align your daily bias with the weekly bias, analyze pre-market liquidity, and execute during smart money hours. By mastering ICT daily bias, you elevate your trading strategy from reactive to predictive, where real profits lie.
FAQs
What is the difference between ICT’s daily bias and regular market trend?
ICT daily bias is specifically based on liquidity analysis and institutional price behavior, whereas market trend may refer to broader price direction without such depth.
Can ICT daily bias change during the day?
Yes. If key levels are broken or new liquidity is introduced, your bias should adapt accordingly.
How can I confirm my ICT bias?
Look for confluence between order blocks, FVGs, session timing, and liquidity sweeps. Confirmation usually involves multiple signals.
Is the ICT daily bias useful for beginners?
Absolutely. It introduces structure and discipline to trading, helping beginners avoid emotional decisions.
What tools do I need to implement ICT bias?
TradingView charts, economic calendar, and a journal to track setups are sufficient to begin.