The ICT Market Structure Shift (MSS) is a powerful trading concept for identifying possible trend reversals and continuations. Introduced by Inner Circle Trader (ICT), the methodology includes price action, liquidity, and market structure to enhance trading precision.
In this article, we will explain:
✔ What is ICT Market Structure Shift (MSS)?
✔ Why does MSS matter for traders?
✔ How to identify MSS on price charts.
✔ Types of MSS (Bullish & Bearish).
✔ Best time frames for MSS.
✔ Proven MSS trading strategies.
Let’s dive in!
What is ICT Market Structure Shift (MSS)?
The ICT Market Structure Shift is one of the most important concepts concerning trading, primarily its relevance to smart money and institutional trading approaches. In terms of price change, it is generally a drastic change in price behavior, indicating the movement of market control from buyers to sellers or vice versa. This shift can identify the potential for trend reversal, anticipated breakout, and continuation patterns, which makes it an important tool in an informed decision-making process.
MSS is rooted in the Inner Circle Trader (ICT) methodology of trading, which considers aspects like market cycles, liquidity, and institutional order flow. Unlike any traditional trend-following systems, Major players shifting positions signal that MSS heads into the direction where retail traders can enjoy high probability set-ups.
Why is Market Structure Shift Important for Traders?
Understanding Market Structure shifts (MSS) is important for you for the following reasons:
Early Trend Reversal Detection:
MSS helps traders identify potential trend reversals early, allowing for proactive trading decisions.
Enhanced Trade Timing:
Detection of the MSS on a price chart gives the best points for entering and exiting trades.
Increased Profit Potential:
Trading in synchronicity with institutional action provides traders with enhanced risk-to-reward ratios.
Reduces False Breakouts:
The MSS confirms that a trend has truly shifted from an analysis of liquidity and price action, making it harder to fall for fake breakouts.
Applicable to All Markets:
Whether in forex trading, cryptocurrencies, or commodities, MSS can be applied to various asset classes and timeframes for all markets.
How to Identify MSS on Price Charts
Market Structure Shift (MSS) recognizes and administers price action with some classical technical signals:
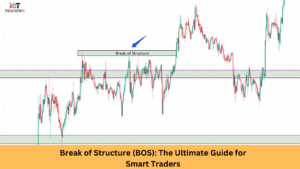
Break of Structure (BOS): This is a potential trend shift when price crosses above a previous high or below a previous low, and a BOS indicates early signs of MSS.
Order Block: This is a zone when institutional traders are either accumulating positions or distributing them, thereby typically marking the outset of an MSS.
Liquidity Grab: The price may take a sweep through previous highs/lows (liquidity) before reversing in direction.
Fair Value Gaps (FVGs): Gaps between candlesticks that depict imbalance as well as possible areas of price reaction.
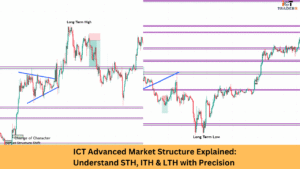
Higher Highs and Higher Lows (or Lower Highs and Lower Lows): A change in structure is only confirmed when any one of these structures is violated.
How to Identify Market Structure Shift on Price
Charts
MSS can be identified by following these steps:
Firstly, look at the current trend. Is it an uptrend, a downtrend, or rather moving in a sideways manner?
Secondly, observe the price behavior that breaks off major support or resistance levels.
Increased volume and strong momentum often accompany MSS.
Use order blocks, liquidity grabs, and fair value gaps as additional confirmation tools.
After an MSS, wait for a pullback or retest before entering a trade to improve accuracy.
Types of ICT Market Structure Shifts (MSS)
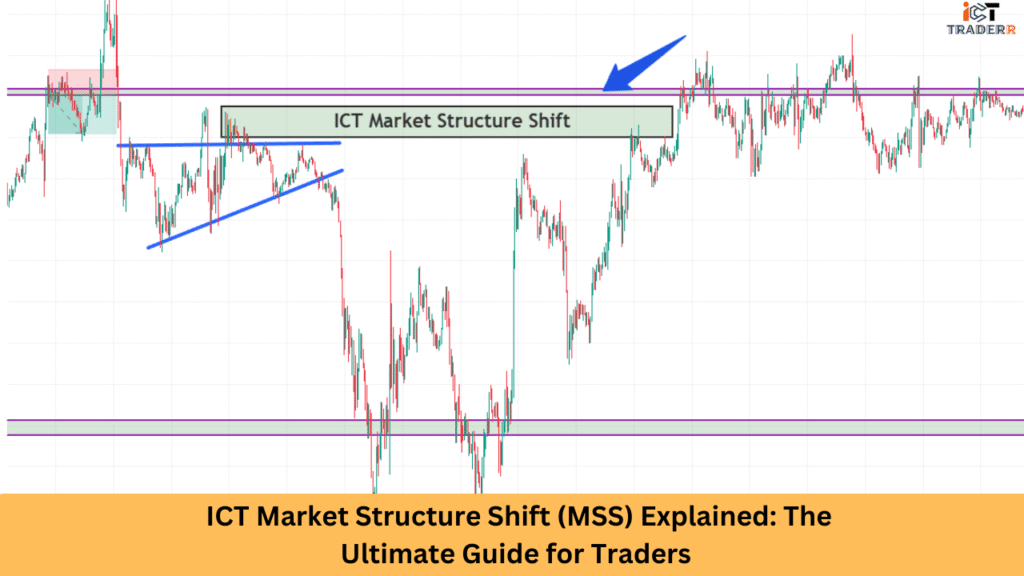
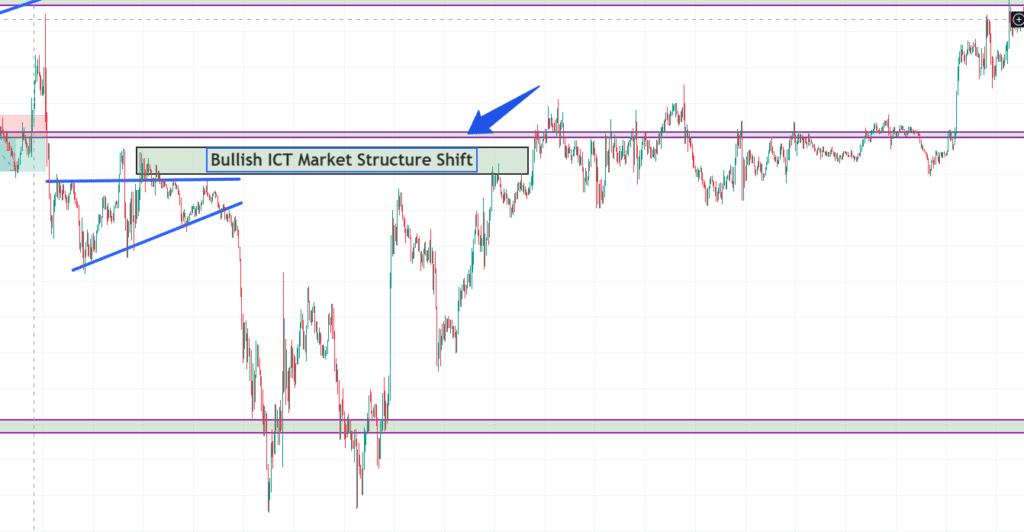
Bullish ICT Market Structure Shift
A bullish MSS occurs when the market transitions from a bearish phase to a bullish phase. It typically involves:
- A break of a key resistance level
- Formation of higher highs and higher lows
- Institutional buying pressure is visible through order blocks
- Price sweeping previous lows before reversing upwards (liquidity grab)
- Confirmation through increased bullish momentum and volume
Example: A stock trading in a downtrend suddenly breaks above a previous swing high with strong volume, confirming a bullish MSS.
Bearish ICT Market Structure Shift
A bearish MSS happens when the market moves from a bullish phase to a bearish phase. It is characterized by:
- A break of a key support level
- Formation of lower highs and lower lows
- Institutional selling pressure through order blocks
- Price sweeping previous highs before reversing downwards (liquidity grab)
- Confirmation through increased bearish momentum and volume
Example: A forex pair trending upwards suddenly drops below a previous swing low with strong selling pressure, confirming a bearish MSS.
Market Structure Shift on Different Time Frames – Which One to Use?
It’s essential to distinguish between Change of Character (CHOCH) and MSS.
MSS can be analyzed on multiple timeframes, but choosing the right one depends on your trading style:
- Scalpers (1-5 minute charts): Look for MSS on lower timeframes to capitalize on short-term price movements.
- Day Traders (15-minute to 1-hour charts): Use MSS to confirm intraday trend changes.
- Swing Traders (4-hour to daily charts): Focus on higher timeframes for more significant trend reversals.
- Position Traders (weekly/monthly charts): Identify macro-level MSS to plan long-term investments.
MSS works on all time frames, but the best depends on your trading style:
| Time Frame | Best For | Example Use Case |
| 1M/1W | Long-term investors | Identifying macro trends |
| 4H/Daily | Swing traders | Catching multi-day moves |
| 15M/1H | Day traders | Intraday reversals |
| 1M/5M | Scalpers | Quick MSS setups |
Trading Strategies Using MSS
1. Break and Retest Strategy
- Identify an MSS with a break in structure.
- Be patient for time to be able to retest that broken level prices.
- Enter the trade with confirmation from order blocks or fair value gaps.
- Place stop-loss below the recent low (for bullish MSS) or above the recent high (for bearish MSS).
2. Liquidity Grab and Reversal
- Watch for a liquidity sweep where price spikes above/below key levels.
- Enter once confirmation of reversal appears (e.g., bullish/bearish engulfing candles).
- Target previous swing highs/lows for profit-taking.
3. Trend Continuation Strategy
- Identify an ongoing trend with MSS confirmation.
- Enter on a pullback into order blocks or fair value gaps.
- Ride the trend until another MSS suggests a shift in direction.
Conclusion
ICT Market Structure Shift (MSS) is a powerful technique in forex trading. It helps you discover reversal trends and high-probability trade setups. Mastery of ICT Market Structure Shift (MSS) opens new doors for traders and enables them to make better decisions in trading. Begin analyzing price charts immediately and start applying MSS in your trading strategy to improve the output results.
FAQs
What is the difference between MSS and Break of Structure (BOS)?
Simply, BOS refers to a structural change, while MSS states trend reversals with different waves, including liquidity grabs and order blocks.
Can MSS be applied to all the financial markets?
Yes, MSS applies to forex, stocks, crypto, commodities, and even indices.
How do I increase the accuracy of identifying MSS?
Use multiple confirmations like order blocks, liquidity sweeps, and fair value gaps, and review MSS on multiple timeframes.
Is MSS beginner-friendly?
Yes, a beginner will first understand the basic concepts in market structure, which learning will guide before bringing MSS into their trading plan.
What indicators help MSS?
Although a pure indicator of price action involves moving averages, RSI, and volume profile, it can add to the confirmation of MSS.