Imagine you’ve spotted a car priced way above its usual value—you’re paying a premium. In trading, ICT Premium Zones are like that: price levels above a fair‑value midpoint where selling opportunities shine. ICT Discount Zones are the opposite—prices below that midpoint, ideal for buying. Mastering these zones lets you enter trades at more favorable prices and manage your risk smartly.
What Are Premium and Discount Zones in ICT?
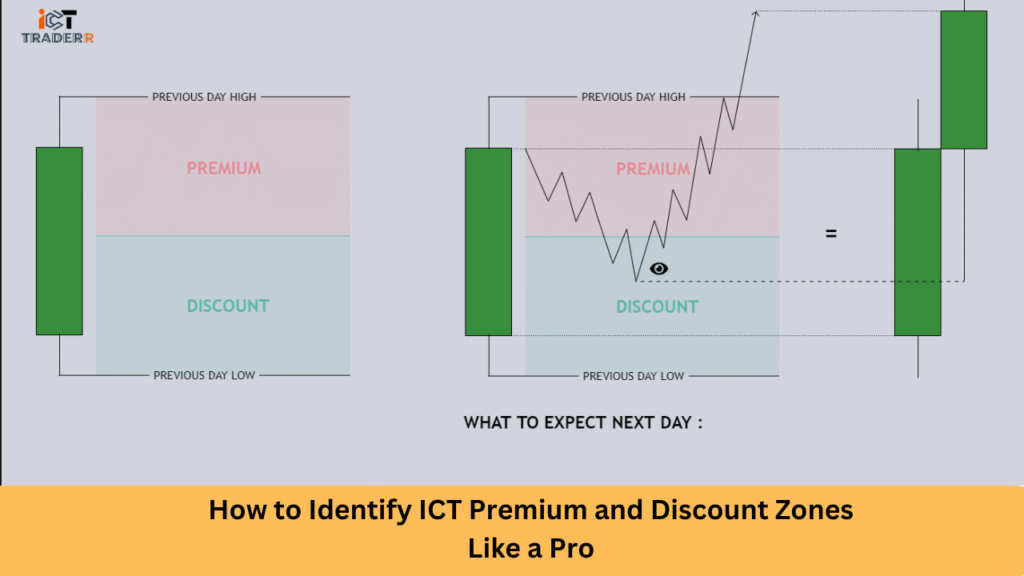
In the Inner Circle Trader (ICT) methodology, markets are split into two halves around a midpoint or equilibrium (often a 50% retracement).
- Premium Zone: The upper half, where the price is overvalued or “expensive.” You look here for sell signals during a downtrend.
- Discount Zone: The lower half—where price is undervalued or “cheap.” You aim to buy setups during an uptrend.
These zones appear across all markets—forex, crypto, stocks, and gold—anywhere price charts are active.
How to Draw Premium and Discount Zones (Step‑by‑Step)
- Define the range: In an uptrend, pick the most recent swing low and swing high. In a downtrend, pick the swing high to swing low.
- Apply Fib retracement: Set 0% at the start, 1 at the end, and include only the 50% level, which marks the fair-value midpoint.
- Identify zones:
- Redraw with Structure Breaks: After price breaks past a recent swing high or low, adjust your zone from that new structure.
That’s it—simple and effective.
How to Use These Zones for Entries
To trade like a pro, you don’t just look at zones—you combine them with price structure and institutional cues:
- In an uptrend, wait for a pullback into the Discount Zone, then look for confirmation like a market structure shift or a bullish fair value gap (FVG) before entering a long.
- In a downtrend, wait for a retracement into the Premium Zone, then look for bearish signals (e.g., pin bar, breaker block) before entering a short.
Combine this with:
- Liquidity pools/order blocks: zones where big players are likely to enter/exit.
- Fair Value Gaps: imbalances that often act as magnets.
- Multi‑timeframe alignment: confirm the trend and zone on daily/h4, then refine entries on lower timeframes like 15m or 5m.
This gives you high‑probability setups: buying dips in discount, selling rallies in premium.
Common Mistakes to Avoid
- Trading zones alone
Without confirmation, zones can fail—price might stay inflated in a strong bull market or continue dropping in a bear market. - Ignoring higher‑timeframe context
Small‑timeframe zones don’t matter if the daily trend is overwhelming. - Overloading charts with every tool
Too many lines (order blocks, gaps, ranges) make it confusing. Focus on the most relevant ones. - Skipping redraws after structural breaks
Stick to old zones after a new low/high break, and you’ll trade outdated levels. - Poor risk management
No stop loss or ignoring structure = disaster. Use tight stops beyond structure breaks and aim for favorable risk/reward in zone-based entries.
Conclusion
By using the ICT model of premium and discount zones, you lean into buying “cheap” in bullish moves and selling “expensive” in bearish ones, with confirmation from price structure, order flow, and fair value gaps.
Keep your charts clean, stay aligned with higher timeframes, manage risk well, and update zones after market structure shifts. That’s how you move from guessing to trading with confidence—just like a seasoned ICT hub trader.
FAQs
Do these zones work on any timeframe?
Yes, but always validate the trend on a higher timeframe (like H4 or daily) before using zones on lower timeframes such as 15m or 5m.
Can I trade without Fibonacci?
Technically, yes, but Fibonacci helps consistently mark the 50% level, your fair-value line. You can replace it with midpoint drawing tools, but some consistent method is essential.
What comes after zone entry?
Set a stop just beyond the recent swing high/low (depending on direction), and target previous swing levels, order blocks, or fair value gaps for take-profit.
Can this work for gold or indices?
Absolutely. Traders use it for Forex, gold, and even stock indices. The method doesn’t change—only your timeframe and instrument.