If you have just stepped into the world of trading, especially following ICT (Inner Circle Trader) principles, you have probably come across the term Swing Low more than once. It may sound simple, but understanding what a true Swing Low is, why it matters, and how it fits into a larger market structure shift can sharpen your edge as a trader.
Let’s break it down in a beginner-friendly way so you can start recognizing these key price patterns with confidence.
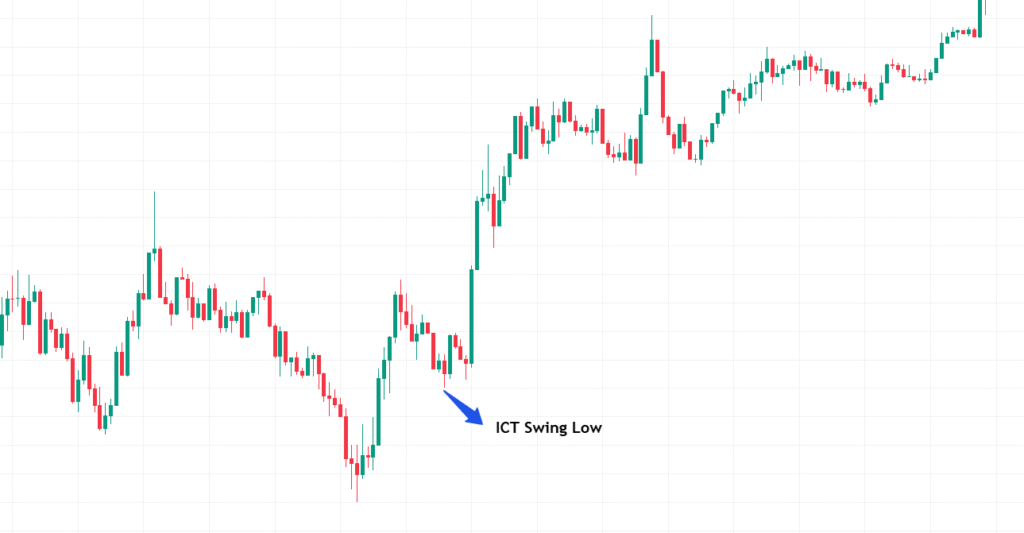
What is an ICT Swing Low?
In trading, patterns are everything, and an ICT Swing Low is a classic example of how price behavior tells a story.
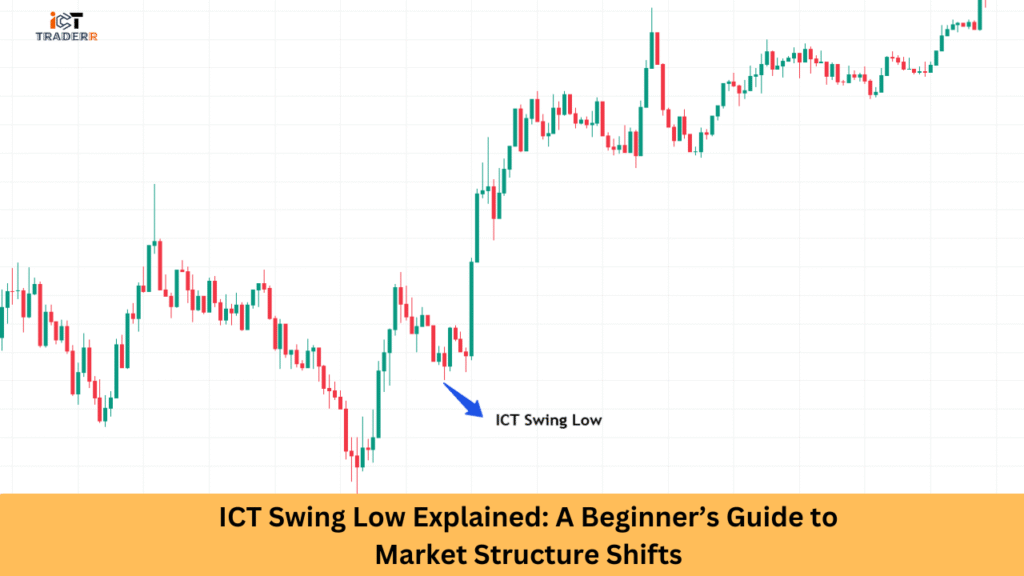
At its core, a Swing Low is a price formation where the market forms a low that is flanked by two higher lows on either side. Picture it like a valley nestled between two hills. In technical analysis, this pattern signals a possible support level and hints at where the price might reverse or bounce.
But in the ICT framework, it’s more than just a pattern—it represents liquidity, market manipulation, and often the moment when retail traders get trapped, just before smart money moves price in the opposite direction.
So, when we say “ICT Swing Low,” we are not just talking about a dip. We are talking about a setup that smart money often uses to trigger stop losses before flipping direction.
Why ICT Swing Lows Matter in Market Structure
Swing Lows are foundational in identifying market direction. Think of them as breadcrumbs that show you the trend’s path.
Here’s why they’re so important:
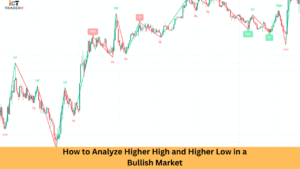
- They help confirm trend reversals or continuations. If you see a new Swing Low forming followed by a higher Swing High, that’s a solid sign of a bullish market structure.
- Swing Lows often reveal liquidity zones. Smart money loves to run stops below these lows before pushing the price up.
- They give context. Instead of reacting emotionally to price dips, Swing Lows help you understand what the market is doing.
In short, spotting a clean Swing Low can help you avoid false breakouts, chase fewer trades, and develop a stronger bias based on structure, not emotions.
How to Identify a True ICT Swing Low
Not all price dips are created equal.
To confidently identify an ICT-style Swing Low, here’s what to look for:
- Three-Candle Pattern: A proper Swing Low has a candle with a lower low than the candles to its left and right. This structure forms a visible trough.
- Location is key: A Swing Low near an order block, fair value gap, or old liquidity level carries much more weight.
- Volume spike: Watch for a quick volume jump. It usually anticipates pulling in liquidity before the reversal comes.
- Timeframe matters: While Swing Lows can appear on any chart, those on 1-hour, 4-hour, or daily charts tend to be more reliable in ICT strategies.
Remember, context is everything. A Swing Low on its is not enough—you want to see it lining up with other tools in your ICT playbook.
Common Mistakes Beginners Make
Let’s be honest—everyone makes these errors when starting. Realizing them is the first step toward growing.
Mistake #1: Thinking every dip is a Swing Low
Not every downward candle is a meaningful Swing Low. Look for the structure: three candles, the middle one lower than both sides. No shortcuts here.
Mistake #2: Trading without context
Spotting a Swing Low in isolation—without understanding the bigger market picture—is like trying to read a map without a compass.
Mistake #3: Using only tiny timeframes
The 1-minute chart might look exciting, but it’s full of noise. Beginners often get faked out because they’re not zooming out.
Mistake #4: No confirmation
Taking a trade just because you think you saw a Swing Low? Dangerous move. Wait for signs of price reaction—a shift in structure, a rejection from an order block, or other confirmation tools from the ICT toolbox.
How Swing Lows Fit into ICT Strategies
ICT strategies just mean applying the mind of smart money. And that means understanding how price is manipulated.
If you want to know in detail, read first the ICT Displacement Move.
Here’s how Swing Lows come into play:
- Entry points: After a liquidity sweep below a Swing Low, ICT traders often look for the price to return to a premium level or an order block to go long.
- Stop placement: Previous Swing Lows are common places to tuck your stops behind, giving the trade room to breathe while protecting your capital.
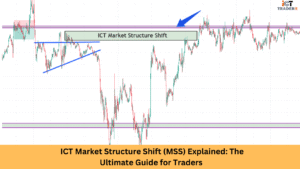
- Market bias: When a new Swing Low forms and price breaks above the previous Swing High, that’s a clear market structure shift. Bullish bias is confirmed.
And here’s a secret: Swing Lows often act as magnets for price. If the market has not taken liquidity from a visible low in a while, chances are it’s coming for it soon.
So learning to anticipate rather than react? That’s where the real edge is.
Conclusion
The ICT Swing Low is much more than a basic pattern—it’s a window into how smart money operates. It reveals where retail traders are getting trapped, where liquidity sits, and where reversals are likely to happen.
By combining Swing Lows with tools like order blocks, fair value gaps, and breaker structures, you’re not just trading what you see—you’re trading what the market intends to do.
If you are new to ICT, make Swing Lows one of your first core concepts to master. They’re simple on the surface, but rich with insight when used correctly.
FAQs
How can I tell if a Swing Low is valid?
Check for the three-candle pattern and confirm with the broader market structure. Is the price breaking highs after forming it? Are there signs of smart money involvement?
Are Swing Lows good entry signals on their own?
Not always. Use them in combination with ICT tools like order blocks, FVGs, and liquidity zones to increase your win rate.
Do Swing Lows work on crypto and stocks?
Yes! ICT concepts apply to any liquid market—Forex, crypto, indices, or stocks. The psychology of price action is universal.
What’s the best timeframe for identifying Swing Lows?
Higher timeframes like 1H, 4H, or Daily give you clearer, more dependable Swing Lows. Lower timeframes can work, but be cautious of false signals.
Why does smart money target Swing Lows?
Because that’s where retail stops are hiding. Price dips below to grab liquidity, then shoots up. If you can spot it, you can ride the wave.