RSI divergence can be a powerful signal if you are new to technical analysis or want to improve your trading strategy. If used correctly, it helps you in identifying potential trend continuations and reversals.
In this article, we will explain what RSI divergence is, how to identify it, and most importantly how to trade it effectively.
What is RSI (Relative Strength Index)
The Relative Strength Index is that oscillator that bounces between 0 and 100 on your charts. Developed by J. Welles Wilder (an actual trading legend) in the late 70s, it measures how quickly prices are moving up or down.
Here’s what the RSI actually tells you:
- When markets are potentially overheated (readings above 70)
- When sellers might have overdone it (readings below 30)
- When momentum is shifting before price actually turns
The math behind it compares average gains to average losses over a specific period (usually 14 candles). But honestly? Don’t sweat the calculation your trading platform does all the heavy lifting. Focus on what it’s telling you instead.
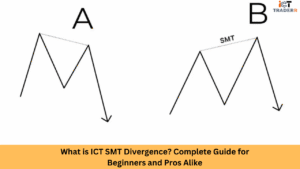
What is RSI Divergence?
This is where things become interesting, RSI divergence occurs when price does one thing while RSI does another. It’s like catching the market in a lie.
I remember the first major divergence I spotted Bitcoin in late 2017. While price kept making those crazy new highs, the RSI was quietly declining. Two weeks later, the crypto market began its infamous crash. That lesson stuck with me.
Divergence basically means:
- Price makes a new extreme (high or low)
- But the RSI refuses to confirm that move
This disagreement often suggests the current trend is running out of steam – like a car that’s still moving forward but with the engine sputtering.
Types of RSI Divergence
In my trading journal, I track two primary types of divergence. Each gives us different clues about potential market turns:
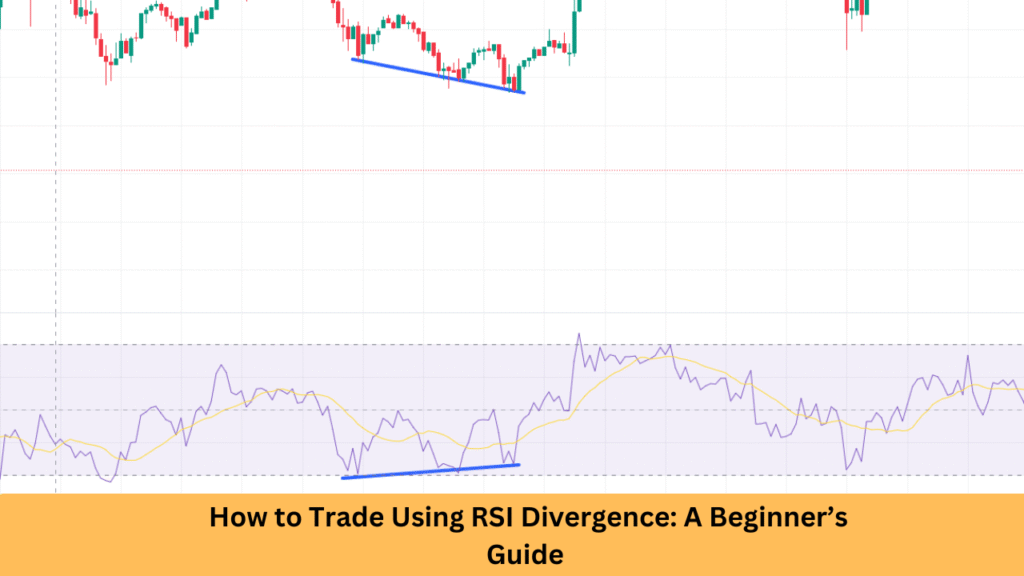
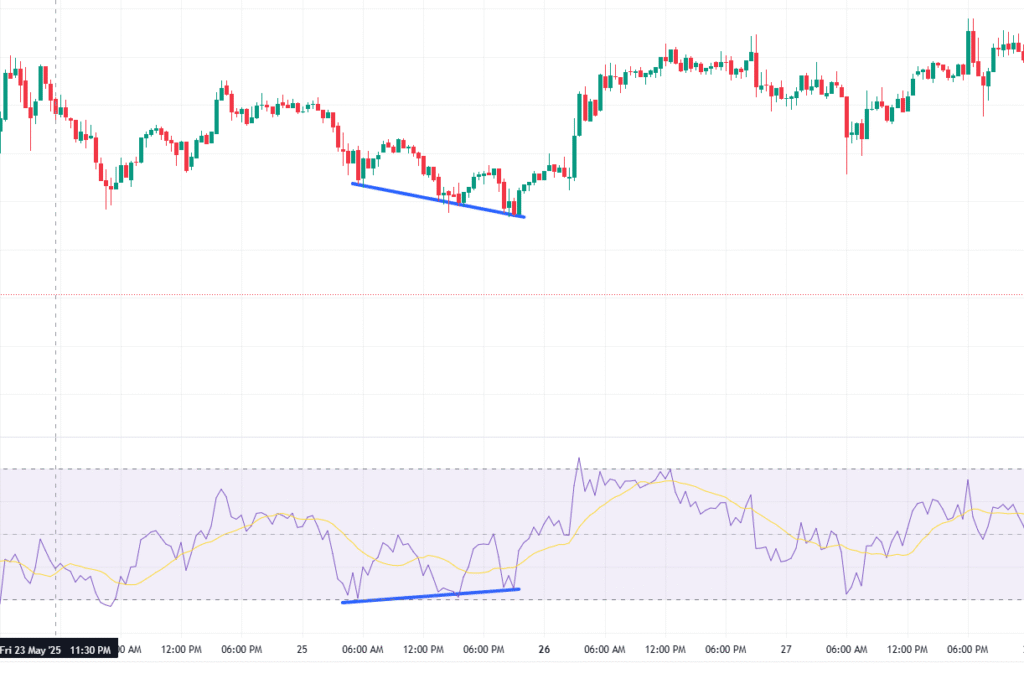
Bullish RSI Divergence
This is my favourite pattern during downtrends. It’s often the first whisper that selling pressure is exhausting itself. Look for:
- Price making a lower low (digging deeper)
- While RSI forms a higher low (showing less downward momentum)
I’ve found these setups particularly juicy after extended selloffs. Last year, I caught a 20% bounce on AMD stock using this exact pattern.
The trick? Don’t jump in too early. I always wait for price to start respecting a support level before pulling the trigger. Patience pays.
Bearish RSI Divergence
When markets get frothy, this is my go-to warning sign. You’ll see:
- Price pushing to a higher high (often with increased media attention)
- While RSI creates a lower high (suggesting weakening momentum)
I missed the 2021 meme stock top by ignoring a textbook bearish divergence on GameStop. The chart was screaming “exit,” but FOMO kept me in. Expensive lesson.
These signals work best near significant resistance or when the RSI ventures above 70. I’ve found they’re particularly reliable after extended rallies when everyone else is feeling euphoric.
How to Spot RSI Divergence on a Chart
After years of squinting at charts, here’s my foolproof process for finding these hidden gems:
- Set up your workspace – I use a clean chart with candlesticks and add RSI below (14-period works great for me)
- Get oriented – First, I identify whether we’re in an uptrend, downtrend, or range
- Find swing points – I mark significant pivots in both price and RSI
- Connect the dots – Drawing trendlines on both helps visualize the divergence
- Look for misalignment – When trendlines go in opposite directions, my attention perks up
One trick I learned the hard way: focus on significant swings only. In the beginning, I saw “divergence” everywhere and overtrained. Not every little wiggle matters.
The divergences that have made me the most money typically:
- Form over several weeks (on daily charts)
- Appear at logical market turning points
- Show up across multiple timeframes
How to Trade RSI Divergence (Entry & Exit Strategy)
After hundreds of trades, here’s the approach that’s worked best for me:
Entry Strategy:
For Bullish Divergence:
- I wait for the lower low in price while RSI forms that higher low
- Next, I look for a “confirmation candle” – usually a strong bullish day
- Only then do I enter, typically just above the high of that confirmation candle
- My stop goes below the recent low (with a bit of breathing room)
For Bearish Divergence:
- After spotting the higher high in price with a lower high in RSI
- I wait for that first serious rejection candle
- Enter short after price breaks below the low of that candle
- Place my stop above the recent high (plus some buffer)
I learned to skip breakeven stops after too many frustrating re-entries. Markets breathe give your trades room.
Exit Strategy:
Here’s where art meets science in my trading:
- For smaller positions, I often use simple 1:2 risk/reward targets
- For higher-conviction trades, I’ll trail stops behind 21-period EMAs
- I almost always take partial profits at obvious resistance/support levels
- When RSI crosses back above 50 in bullish trades (or below 50 in bearish ones), I tighten stops considerably
One exit rule that’s saved me repeatedly: if price moves strongly in your favor but RSI diverges again, take profits immediately.
Conclusion
RSI divergence is not just another indicator it’s a window into the internal health of price trends. After years of trading, I still consider divergence among the most reliable early warning systems for potential reversals.
What I love most about divergence trading is that it forces you to think contrary to the crowd. While everyone else is caught up in price action, you are tracking the momentum beneath the surface.
Start small, be patient, and trust the process. Your first few divergence trades might not be home runs, but stick with it. The skill compounds over time.
FAQs
Is RSI divergence reliable?
RSI divergence is reliable when confirmed with other indicators or chart patterns. It’s a signal of momentum loss, not an immediate price reversal.
Which timeframe is best for RSI divergence?
The 1-hour, 4-hour, and daily time frames provide the best balance of signal quality and reliability for RSI divergence trades.
Is it possible to use RSI divergence for day trading?
Yes, some day traders use RSI divergence with lower time frames such as 5-minute or 15-minute charts; however, it is riskier, and quick decisions would need to be made.
Should I use RSI alone for trading?
It’s better to use RSI in combination with price action, volume, or moving averages to improve accuracy and reduce false signals.
What is the RSI default setting?
The standard RSI setting is a 14-period calculation, but you can adjust it based on your strategy or asset.