Trendlines are among the most fundamental tools used in technical analysis, enabling traders to identify and understand market trends. A trendline is a straight line, drawn on a price chart to connect two or more price points, indicating the general direction of the market. With the proper use of trendlines, you can assess potential support and resistance levels, which are essential for informed decision-making. support and resistance often complement trendline strategies.
In this article, you will learn How to Use a Trendline, types of trendlines, How professional traders use trendlines” and common mistakes traders make with trendlines.
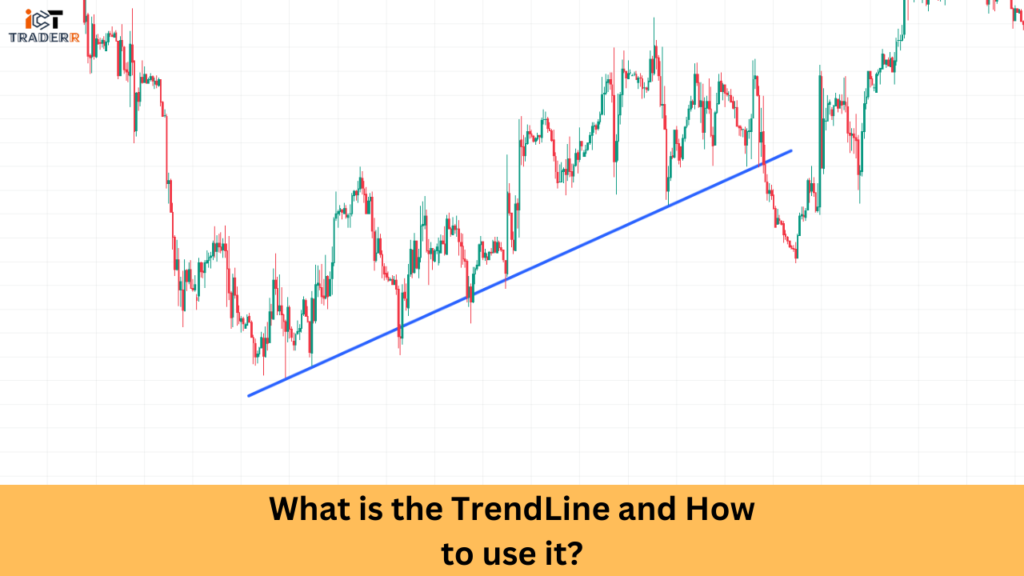
What Is a Trendline?
A trendline shows the trend direction of price movement in the market. The trend direction could be upwards, downwards, or sideways. Trendlines serve as road maps that take shape from the analysis of past data and predict future price movements.
Why Are TrendLines Important?
There are several reasons trendlines matter in trading. They include:
Establishing Market Direction: Trendlines usually help a trader know whether the market is in an uptrend, downtrend, or in between.
Determining Entry and Exit Levels: Trendlines serve as mobile support and resistance levels, hence giving a timely signal to buy or sell an asset.
Confirming Breakouts or Reversals: Break above a trendline or below indicates the possibility that the trend is changing or continuing.
Improving Technical Analysis: With the use of the trend with indicators such as RSI, MACD, and moving averages, predictions become more accurate.
Types of Trendlines
There are three main types of trendlines traders use:
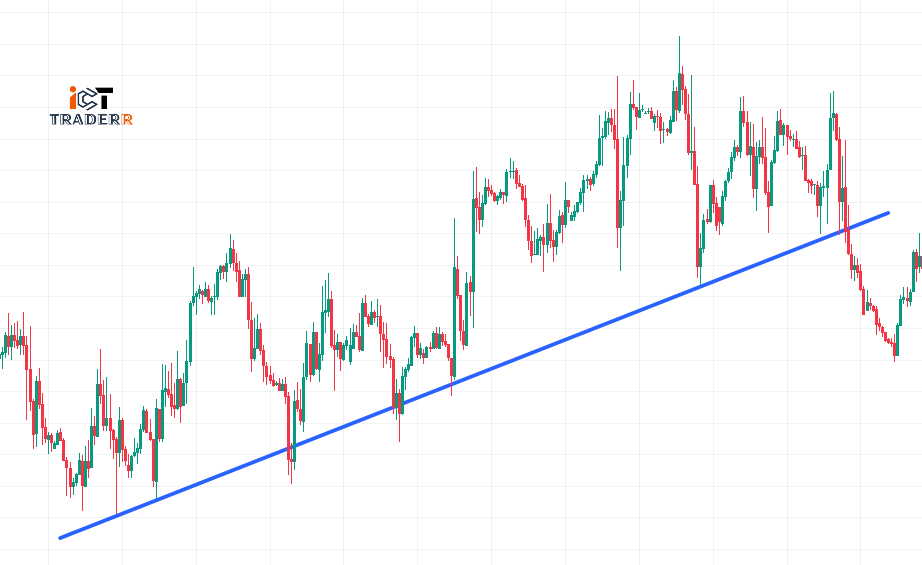
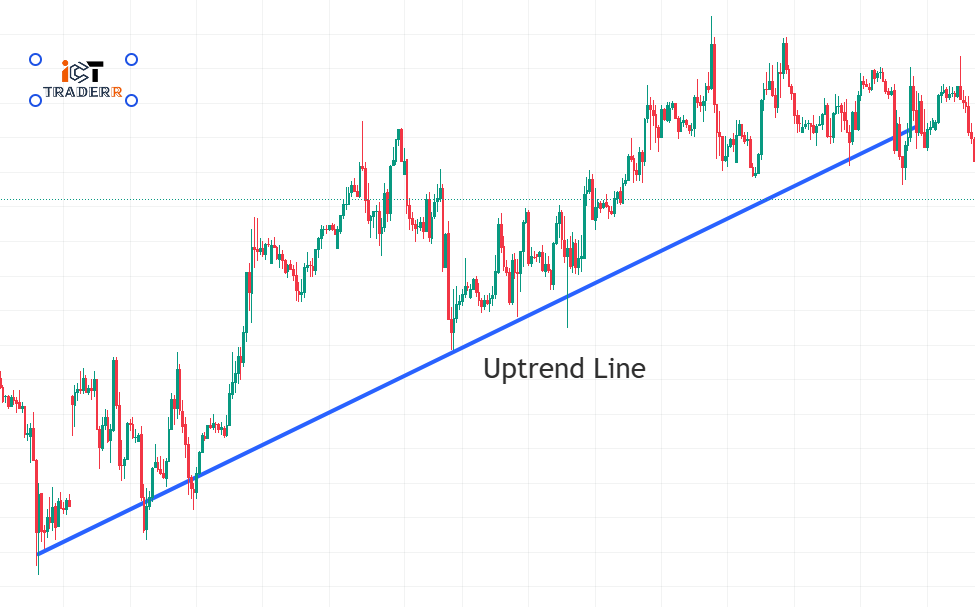
1. Uptrend Line (Going Up)
- This line connects the lowest points when prices are going up
- It shows that buyers are in control and prices are rising
- Traders often buy when prices touch this line
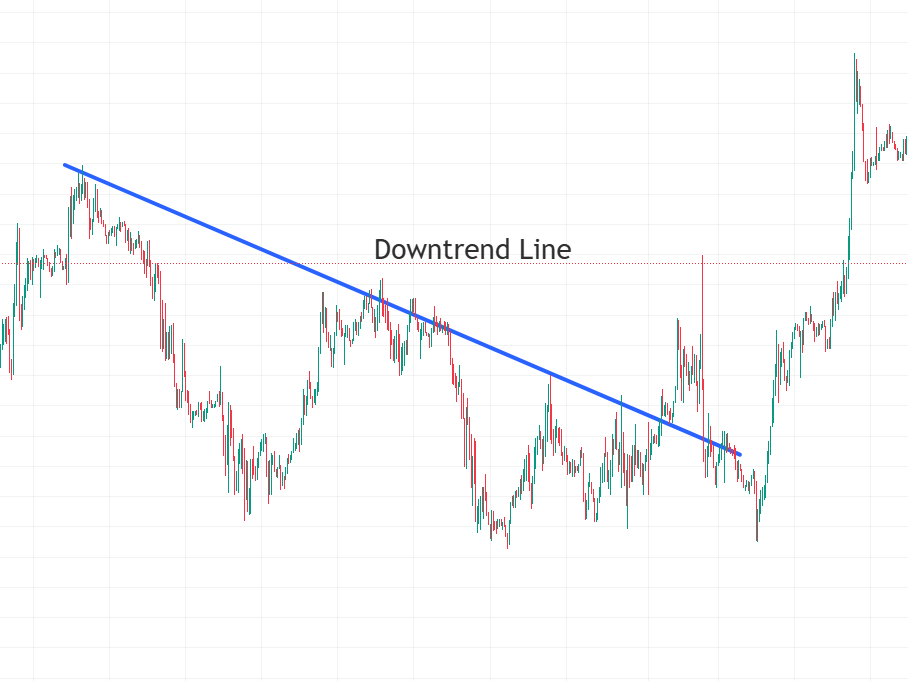
2. Downtrend Line (Going Down)
- This line connects the highest points when prices are falling
- It shows that sellers are in control and prices are dropping
- Traders often sell when prices reach this line
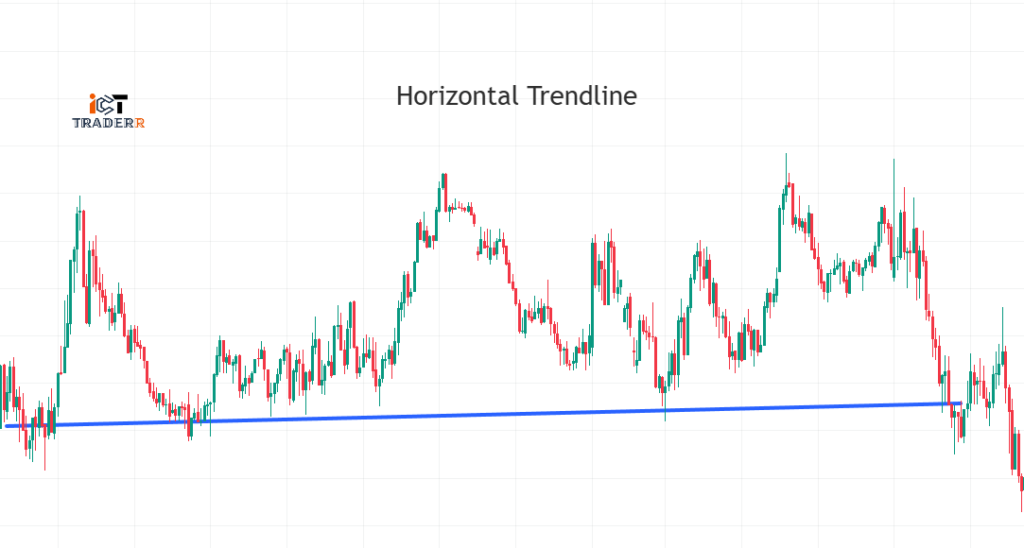
3. Horizontal Trendline (Staying Flat)
- This is a straight line across the chart when prices aren’t moving much up or down
- It shows that buyers and sellers can’t decide which way prices should go
- Prices bounce between the same high and low points
How to Draw a Trendline Correctly?
Drawing a trendline accurately requires both precision and a deep understanding of price action. The following steps can be followed for accuracy:
Identify the Trend: See the price chart and define whether the market is trending upward, downward, or horizontally.
Choose key price points: Choose at least two significant highs (for a downtrend) or at least two significant lows (for an uptrend) for drawing the line.
Use Charting Tools: The trendline tool available on your trading system is to be used to link the selected points.
Extend the Line: This expands the trendline so that it goes farther than just the most recent action of price in anticipation of future actions.
Validate the Trendline: Confirm that multiple price touches validate the reliability of the Trendline before making trading decisions.
Common Mistakes Traders Make with Trendlines
Many errors can occur among traders as they draw their trendlines and function with them. Here are some common mistakes to be avoided:
Forcing Trendlines Down a Bias: The trendline has to show market movements it should never be forced upon a trader’s expectations.
Using Only Two Points: It certainly is possible to graph a trendline using just two points, but the more confirmations, the better.
Ignoring Trend-Line Breaks: In either case, not recognizing the break of a trendline may result in losing a trading opportunity as well as any potentiality loss.
Depend on Trendlines Alone: These trendlines, are best used in conjunction with other technical analysis tools, moving averages, RSI, or MACD.
Overusing Trendlines: The market situation changes; thus they may give wrong predictions if used too much.
Conclusion
Trendlines are essential technical analysis tools that help traders identify trends, support, and resistance levels. Drawing those trendlines accurately and using them for analyzing the price movement can enhance the ability of traders to make predictions regarding the market situation with reasonable assurance. However, it is important to note here that trendlines must not be divorced from other technical indicator readings. Thus, mastering the trendlines can upgrade chances for success in marketing while trading.
Frequently Asked Questions
How do you best draw a trendline?
Drawing a trendline is best done by connecting at least two significant highs or lows in line with many confirmations for accuracy.
What is the proof of the validity of a trendline?
A trendline becomes valid when touched by at least three prices and is in the overall direction of the trend, though the trendline may not be relevant.
Can market reversals be predicted by trendlines?
A potential market reversal can be indicated if, along with a strong volume break, the trendline sees confirmation from other indicators.
How often should trendlines be adjusted?
Trendlines are adjusted in any new price data; too many adjustments indicate weak trendlines.
Do professional traders use trendlines?
Yes, professional traders use trendlines with other technical analysis tools to increase their trading strategies and market choices.